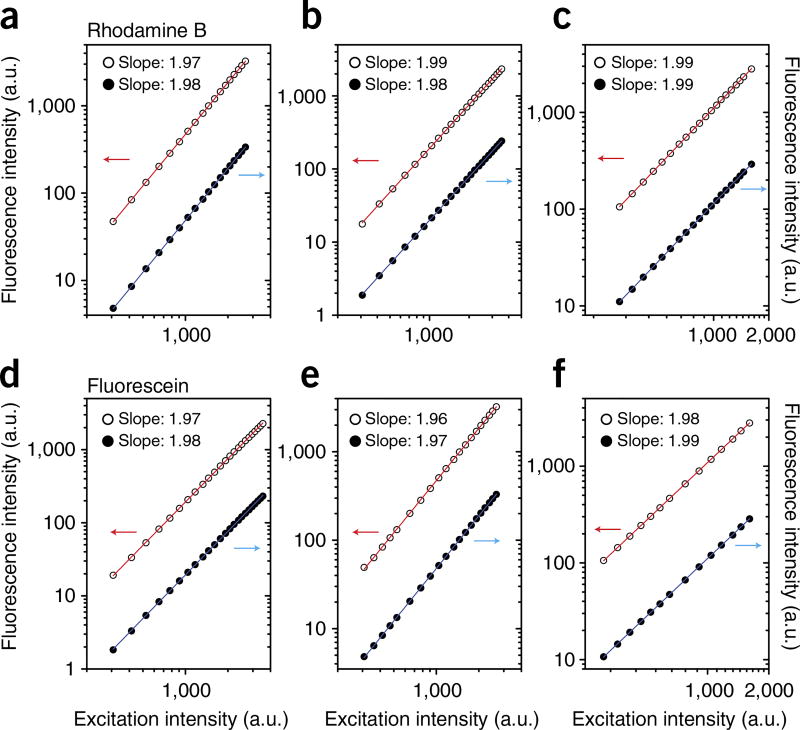
Figure 9.
PMT intensity responses across their dynamic ranges at different voltage settings. The responses are measured at different detection wavelengths using different calibration solutions. (a–c) Rhodamine B. (d–f) fluorescein. Voltage settings for PMT3 and PMT4 are 498 and 559 V, respectively (a,d); 558 and 629 V, respectively (b,e); 625 and 706, respectively (c,f). PMT3 is shown in red, and PMT4 is shown in black. Red and blue arrows indicate the proper vertical axes (left or right) for each fitted data set.

