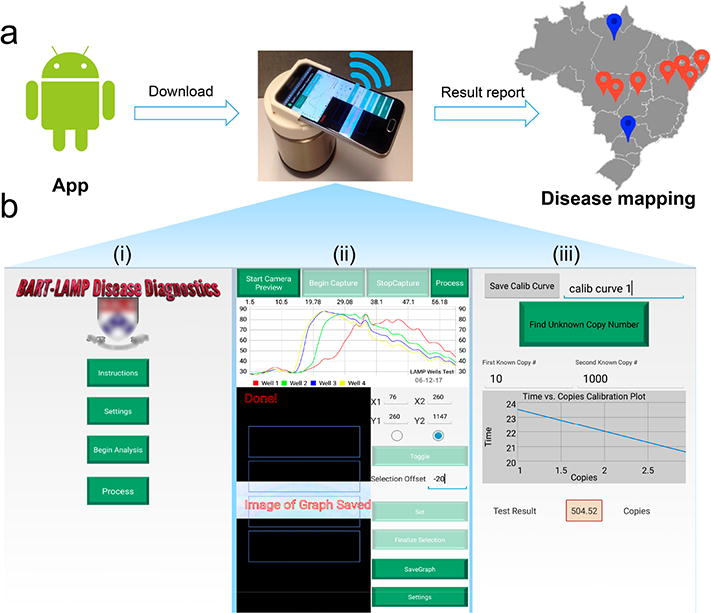
Figure 2.

Android App for the smartphone-based molecular detection and disease mapping. (a) A flowchart of the SCC-based molecular detection and disease mapping. Red and blue dots denote, respectively, locations of positive and negative tests. (b) Screenshots of our smartphone interface: (i) main menu, (ii) real-time monitoring of the reactors of the MIAR chip, and (iii) calibration curve and result report.
