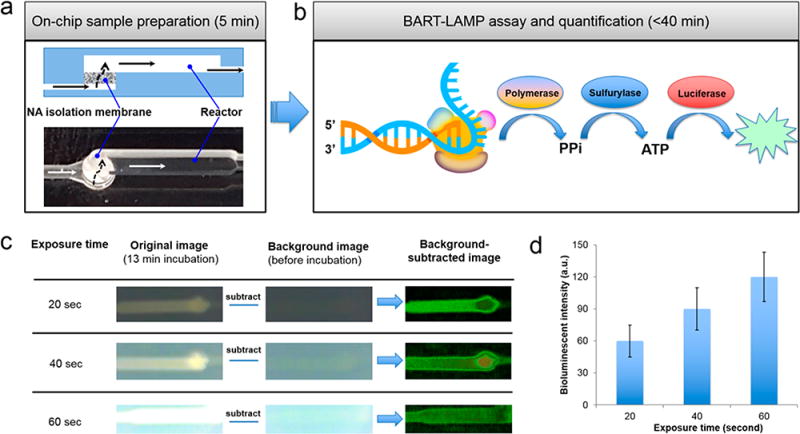
Figure 3.

Excitation/filter-free BART-LAMP assay on the MIAR chip. (a) A cross-section (top) and a top image (bottom) as imaged by the smartphone camera of the flow-through reactor with nucleic acid isolation membrane. (b) Schematic of the light emission process during DNA synthesis. (c) Illustration of image processing to remove background noise at various exposure times. (d) Processed bioluminescence intensity as a function of camera’s exposure time (n = 3).
