
Figure 4.
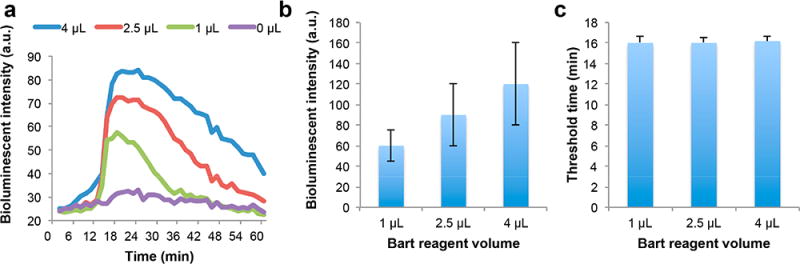
The effect of BART reporter concentration on BART-LAMP amplification curves and threshold times. (a) BART-LAMP emission intensity as a function of time with different volumes of BART reporter. The ZIKV RNA template concentration is 103 PFU per sample. (b) The bioluminescent intensity as a function of the volume of BART reporter (n = 3). (c) The threshold time (min) as a function of the volume of BART reporter volume (n = 3).