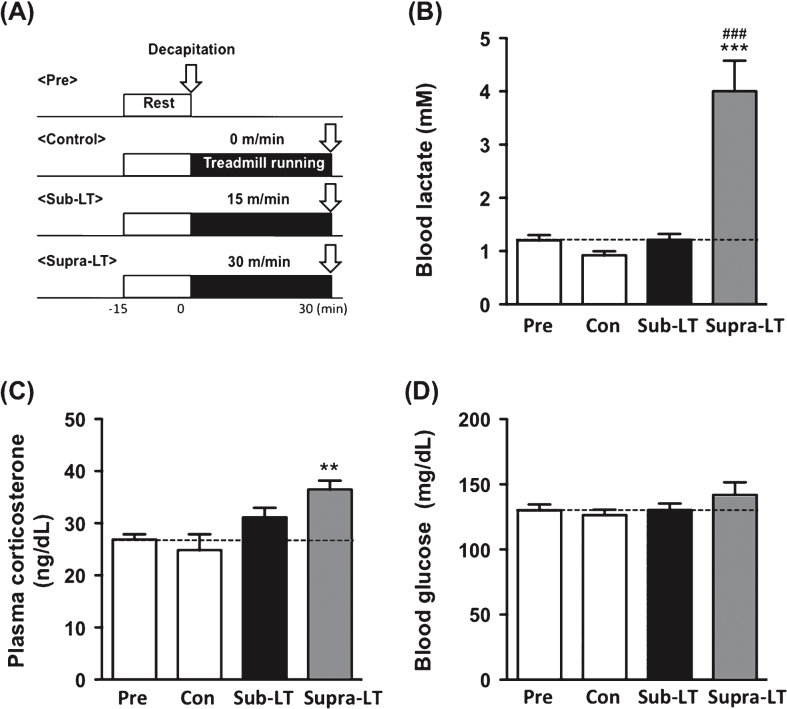
Fig.2.
Determination of blood lactate, glucose, and plasma corticosterone after different intensities of exercise (A) Protocols for different intensities of exercise, (B) blood lactate levels (F (3,24) = 23.47, p < 0.0001), (C) plasma corticosterone levels (F (3,24) = 6.31, p = 0.0026), and (D) blood glucose levels (F (3,24) = 1.17, p = 0.34). Data represent the mean ± SEM (n = 7 mice per group). **, p < 0.01, ***, p < 0.001 in comparison with control and # # # , p < 0.001 in comparison to sub-LT (one-way ANOVA Tukey post hoc tests).

