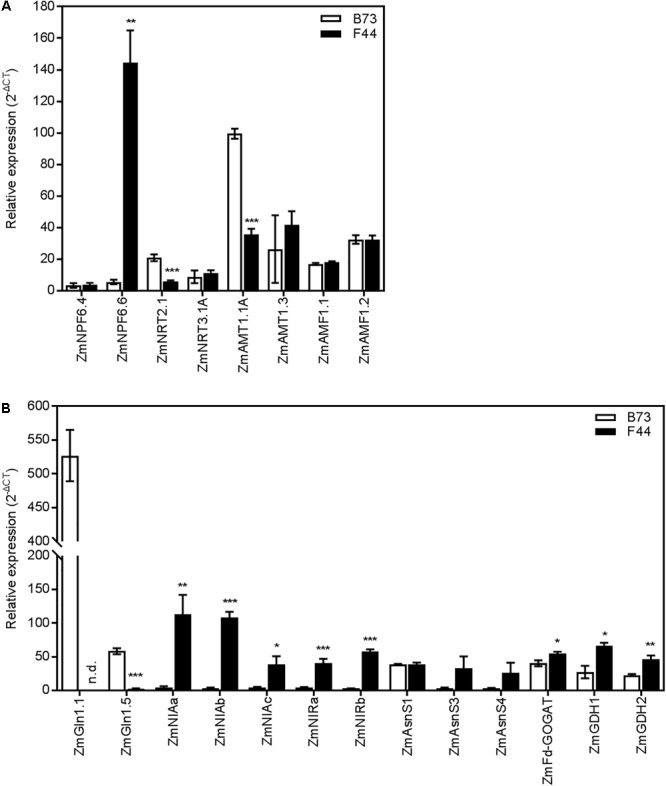
FIGURE 3.

Gene expression in B73 (white) and F44 (black) roots. (A) Expression of nitrogen transporter genes. (B) Expression of nitrogen metabolism pathway genes. Values are means (±SE) from three individual plants. Similar results were obtained in another independent experiment. Asterisks indicate significant differences between lines at ∗P < 0.05, ∗∗P < 0.01, ∗∗∗P < 0.005 (Student’s t-test). NPF/NRT, nitrate transporter; AMT, ammonium transporter; AMF, ammonium facilitator; GLN, glutamine synthetase; NIA, nitrate reductase; NIR, nitrite reductase; AsnS, asparagine synthetase; GOGAT, glutamate synthase; GDH, glutamate dehydrogenase; n.d., non-detectable.
