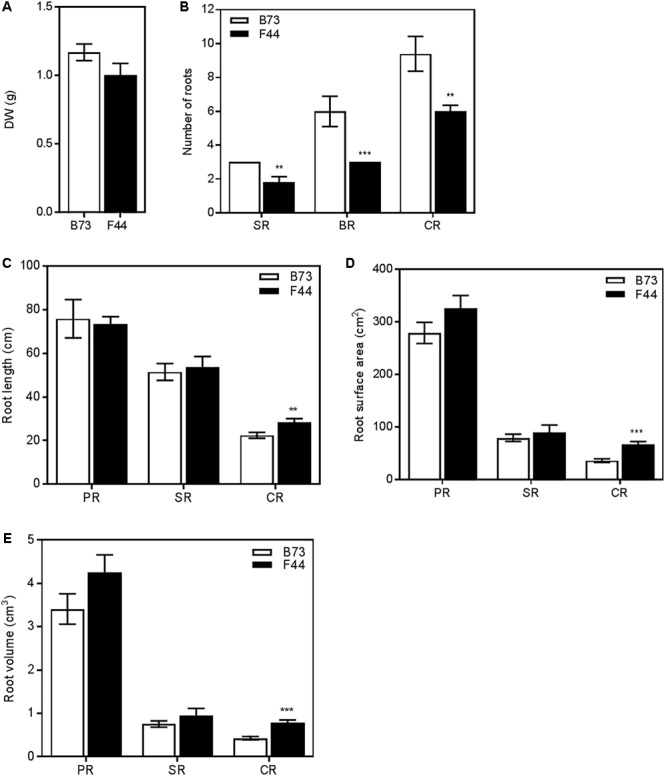
FIGURE 4.

Root architecture measurements of B73 (white) and F44 (black) plants grown on sand. (A) Total root system dry weights. (B) Number of seminal roots (SR), brace roots (BR) and crown roots (CR). (C) Individual root lengths. (D) Individual root surface areas. (E) Individual root volumes. Values are means (±SE) from five individual plants. Similar results were obtained in another independent experiment. Asterisks indicate significant differences between lines at ∗∗P < 0.01, ∗∗∗P < 0.005 (Student’s t-test).
