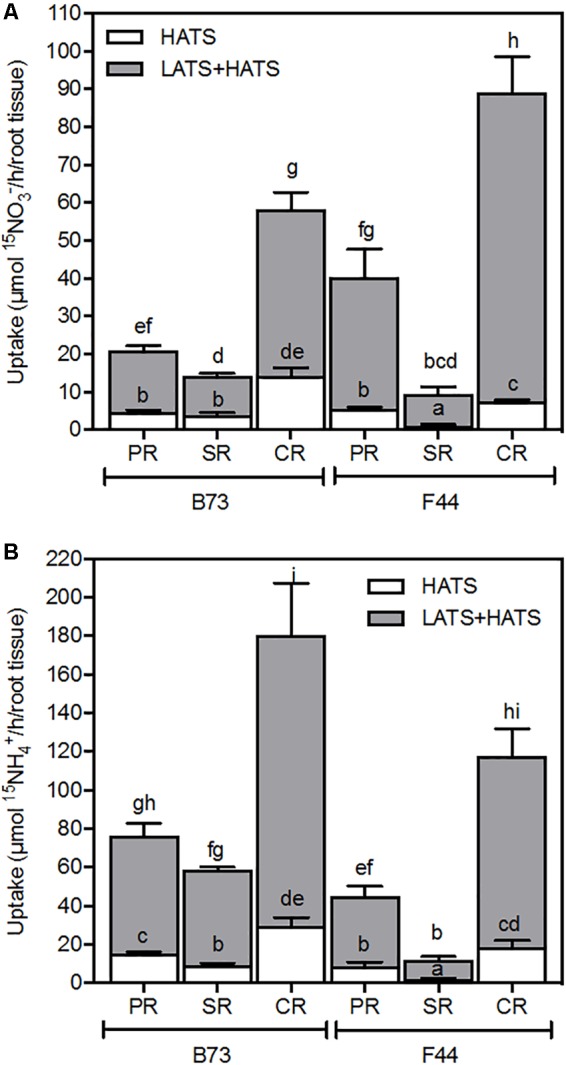
FIGURE 6.

Nitrate (A) and ammonium (B) uptake capacity of B73 and F44 in the PR, SR, and CR root tissues. Values are means (±SE) from five individual plants. Different letters indicate significant differences among means at P < 0.05 (ANOVA).

Nitrate (A) and ammonium (B) uptake capacity of B73 and F44 in the PR, SR, and CR root tissues. Values are means (±SE) from five individual plants. Different letters indicate significant differences among means at P < 0.05 (ANOVA).