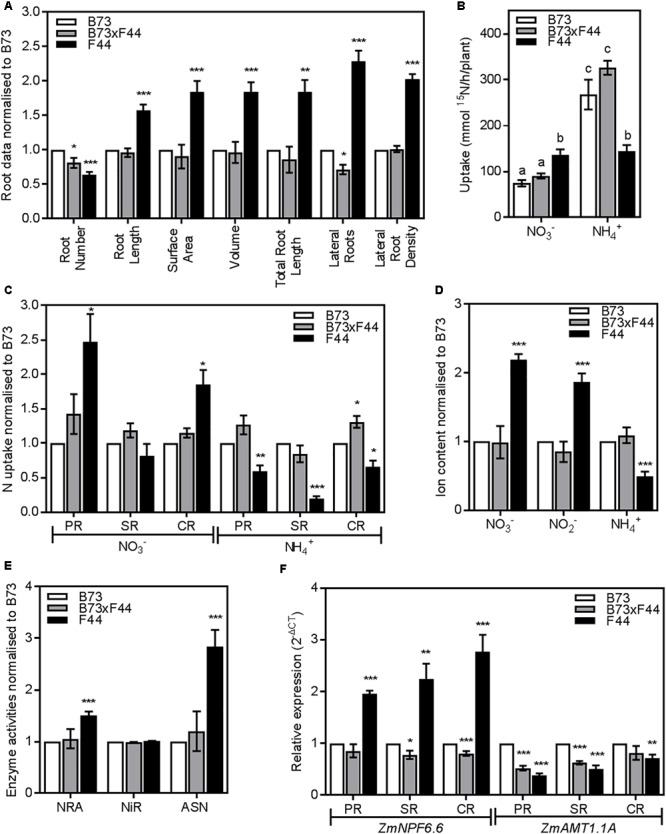
FIGURE 8.

Phenotypic comparison of F1 BK3 (gray) and parental B73 (white) and F44 (black) roots. (A) Crown root measurements normalized to B73. (B) Low affinity transport (LATS+HATS) of 2.5 mM of nitrate (NO3-) and ammonium (NH4+). (C) NO3- and NH4+ LATS+HATS capacities in the PR, SR, and CR root tissues normalized to B73. (D) Measurements of nitrate (NO3-), nitrite (NO2-), and ammonium content (NH4+) normalized to B73. (E) Analysis of nitrate reductase activity (NRA), nitrite reductase activity (NiR), and asparagine synthetase activity (ASN) normalized to B73. (F) ZmNPF6.6 and ZmAMT1.1A gene expression in the PR, SR, and CR root tissues normalized to B73. Values are means (±SE) from 3 to 8 individual plants. Asterisks indicate significant differences with B73 at ∗P < 0.05, ∗∗P < 0.01, ∗∗∗P < 0.005 (Student’s t-test). Different letters indicate significant differences among means at P < 0.05 (ANOVA).
