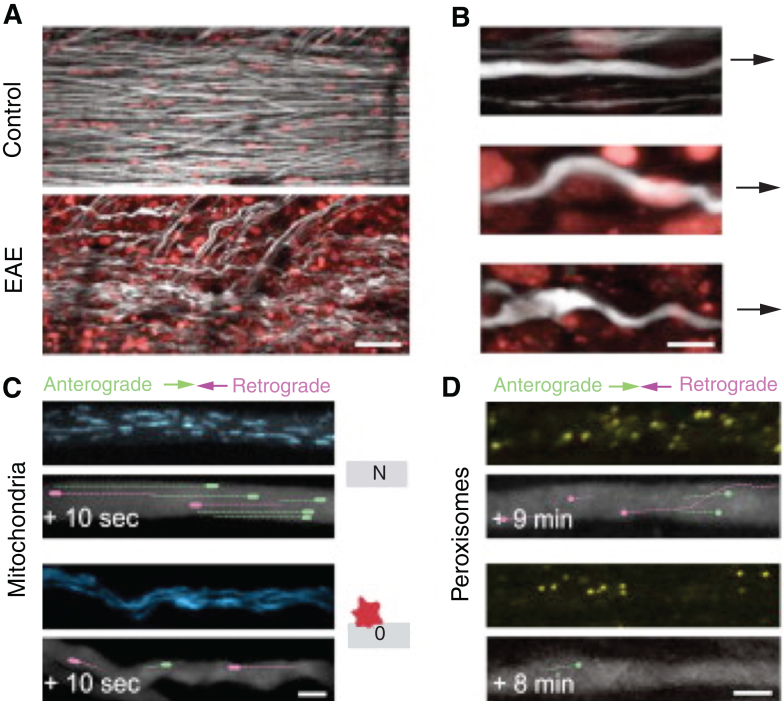
Fig.5.
In vivo of Organelle Transport in neuroinflammatory lesions (A) In vivo two-photon image of the spinal cord of a control Thy1 -YFP-16 × Thy1-MitoCFP-P mouse (top) and a Thy1-YFP-16 × Thy1-MitoCFP-P mouse 2 days after onset of EAE (bottom; axons, white; nuclei labeled by in vivo application of Nuclear-ID Red, red; mitochondrial channel not shown). (B) Magnified views of axons from neuroinflammatory lesions illustrating different stages of axon morphology (N, axon from a control mouse; normal-appearing axon within an inflammatory lesion and swollen axon within an inflammatory lesion. (C and D) In vivo two-photon time-series images of control axons (top) and stage 0 axons imaged 2 days after onset of EAE (bottom) with moving mitochondria (C), in Thy1-YFP-16 × Thy1-MitoCFP-P mice, and peroxisomes (D), in Thy1-OFP-3 × Thy1-PeroxiYFP-376 mice, represented as pseudo-colored overlays (lines represent tracks during the indicated time period). Note that anterograde transport is more significantly affected than retrograde transport (adapted with requested permission from Ref. 58).

