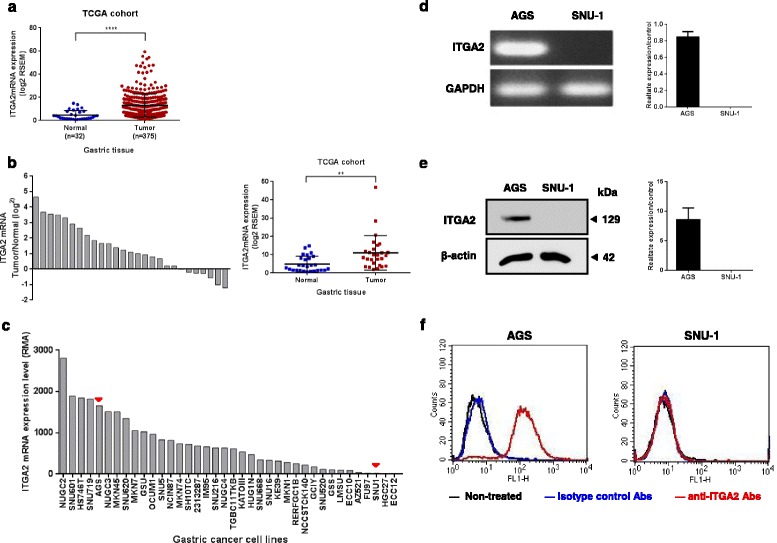
Fig. 1.

Analysis of ITGA2 expression levels in gastric cancers. a Data of ITGA2 mRNA levels were extracted from 32 normal gastric tissue and 375 gastric cancer tissue in the TCGA datasets. The result was expressed as mean ± standard deviation (SD), and statistical comparisons were made by Wilcoxon signed rank test. **** p < 0.0001. b The mRNA levels of ITGA2 in 27 available paired gastric normal and tumor tissues were compared, and a positive log2 (tumor/normal) value indicates increased expression, while a negative log2 value indicates decreased expression, of ITGA2 in the gastric tumor tissues. ITGA2 mRNA was significantly overexpressed in gastric tumor tissues as compared with normal tissues (p < 0.01, paired t-test). Result was expressed as mean ± standard deviation (SD). c mRNA expression profiles for ITGA2 across gastric cancer cell lines in the Cancer Cell Line Encyclopedia (CCLE) database. Red arrowheads mark the expression levels of AGS and SUN-1 cells. d The expression of ITGA2 mRNA was measured by quantitative real-time PCR in AGS and SNU-1 cells. Glyceraldehyde-3-phosphate dehydrogenase (GAPDH) was used as an internal control. e The ITGA2 protein expression was semi-quantified by western blot analyses. d and e The densitometric measurements of ITGA2 in AGS and SNU-1 cells were normalized to the internal control (β-actin). f The surface expressions of ITGA2 were determined on PI-negative cells, using flow cytometry. Data are representative of three independent experiments
