
Fig. 4.
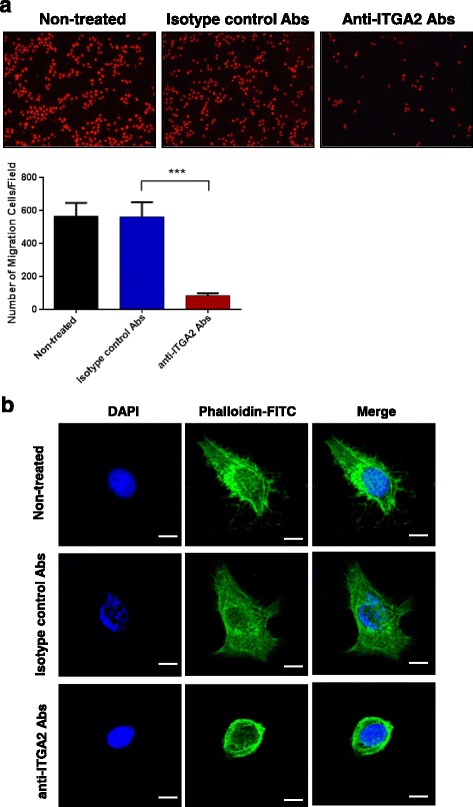
Blockade of ITGA2 reduced migration of AGS cells. a AGS cells were treated with 0.1 μg anti-ITGA2 antibodies or isotype control antibodies (negative control) for 18 h. Cells in the lower face of transwell membranes were stained by PI and imaged (upper panel) and data summarized as mean ± standard deviation (S.D) (lower panel). Statistical comparisons were made by two-way ANOVA with Bonferroni comparisons. *** p < 0.001. b AGS cells were treated with 0.3 μg of the anti-ITGA2 antibody for 12 h. F-actin (green) was stained with FITC-conjugated phalloidin, and nuclei stained by DAPI. Scale bar = 10 μm. Data are representative of three independent experiments