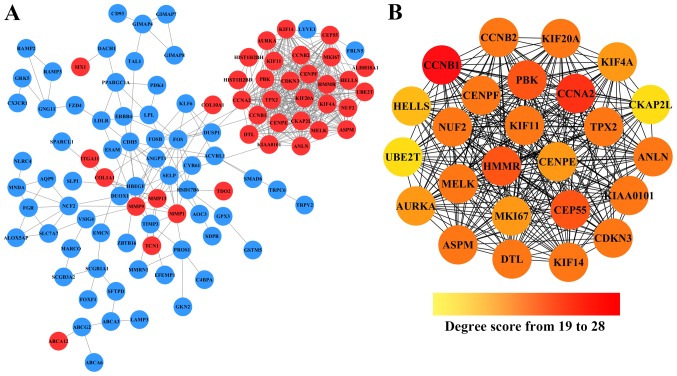
Figure 2.
The constructed PPI network of DEGs. (A) A total of 195 overlapping DEGs were used as seed genes to build a PPI subnetwork based on the STRING database. Red nodes represent the upregulated DEGs, while bule nodes represent downregulated DEGs. Edges between the nodes represent their interation. (B) The screened subnetwork of hub genes. The color changes with the increase of degree score from orange to red, all nodes represent the upregulated genes.

