Figure 4.
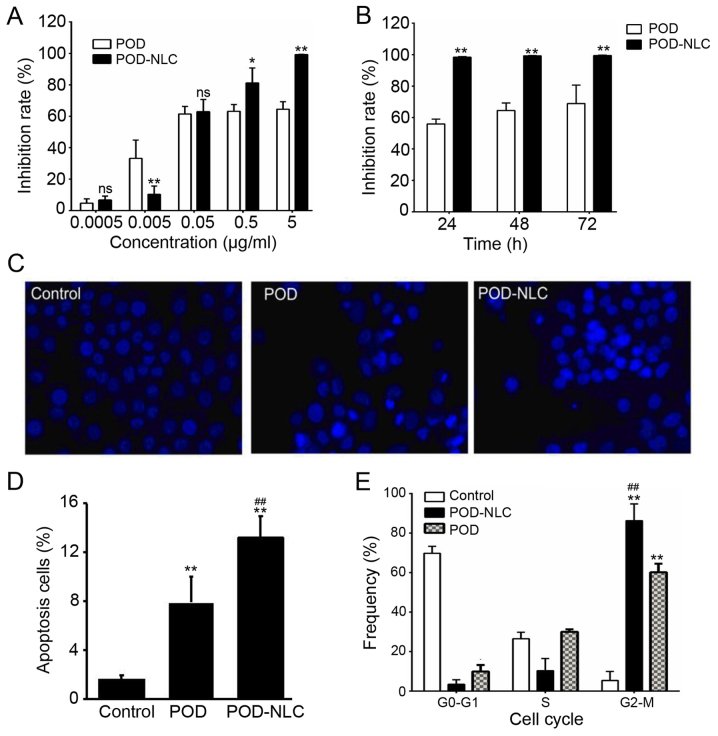
POD-NLC inhibits cell proliferation in VK2/E6E7 cells. (A) Comparison of inhibitory effects of different concentrations of POD-NLC and free-POD following 48 h of treatment. Ns, no significant difference vs. POD group; *P<0.05 and **P<0.01 vs. corresponding POD group. (B) Comparison of inhibitory effects of 5 µg/ml POD-NLC and free-POD-T following 24, 48 and 72 h of treatment. **P<0.01 vs. the POD group. (C) Morphological alterations of VK2/E6E7 cells incubated with normal saline (control), 0.05 µg/ml POD-NLC or 0.05 µg/ml POD for 48 h were observed by a fluorescence microscopy (Hoechst 33342; magnification, ×400). (D) The total number of apoptotic cells and the percentage of the late and early apoptotic cells were quantified. (E) Percentage of VK2/E6E7 cells in different phases of the cell cycle. The number of VK2/E6E7 cells in the G0-G1, S and G2-M phases and the corresponding percentage values were calculated for normal saline, 0.05 µg/ml POD-NLC and 0.05 µg/ml POD-T groups following 48 h of treatment. **P<0.01 vs. the control (normal saline) group; ##P<0.01 vs. the POD group.

