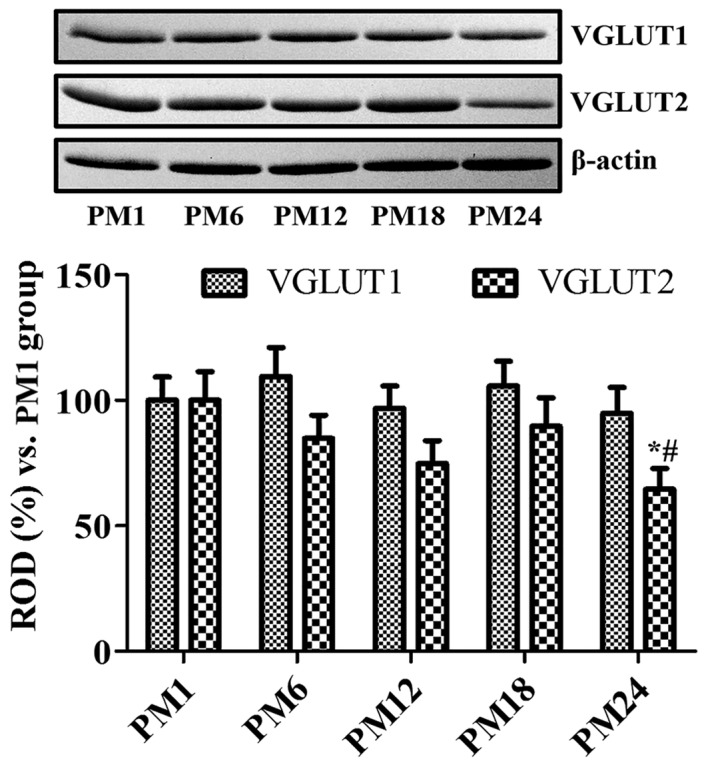
Figure 4.

Western blot analysis. Protein levels are expressed as a percentage of VGLUT1 and VGLUT2 protein levels normalized by their respective β-actin protein level in the hippocampal homogenates of the PM1, PM6, PM12, PM18 and PM24 groups (n=5/group). Data are presented as the mean ± standard error mean. *P<0.05 vs. PM1 group; #P<0.05 vs. PM18 group.
