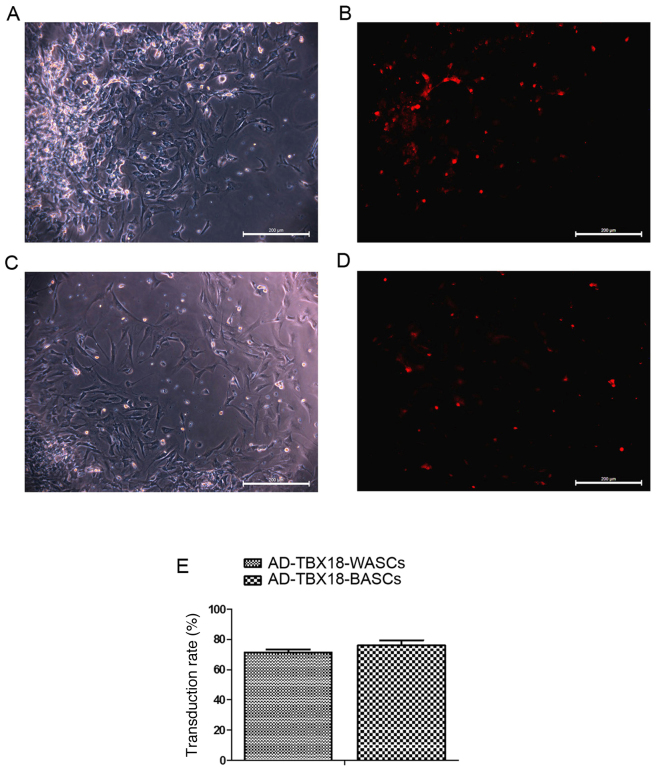
Figure 3.
Transduction of TBX18 in BASCs and WASCs. BASCs transduced with TBX18 were observed under an (A) light and (B) fluorescence microscope. WASCs transduced with TBX18 were observed under a (C) light and (D) fluorescence microscope. (E) Transduction rates in the two groups were not significantly different. Data are presented as the mean ± standard error of the mean n=3. Scale bar, 200 µm. TBX18, T-box 18; BASCs, brown adipose-derived stem cells; WASCs, white adipose-derived stem cells; AD, adenovirus.

