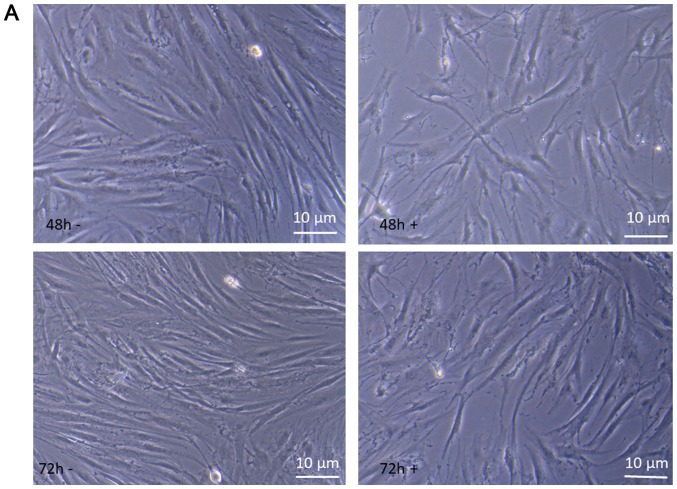
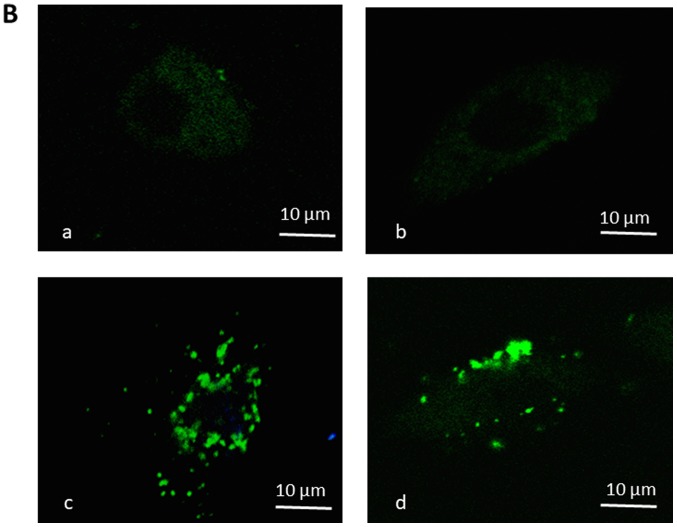
Figure 6.
(A) When compared with control cells, cells treated with 1 µmol IM (48 + and 72 h +) did not grow as well and displayed heterogeneous morphological aspects with frequent cytoplasmic arborizations. (B) Annexin V staining. Images a and b are the control untreated cells, while images c and d are the keloid fibroblasts following 72 h of incubation with 1 µmol IM. Scale bars=10 µm. IM, Ingenol Mebutate.


