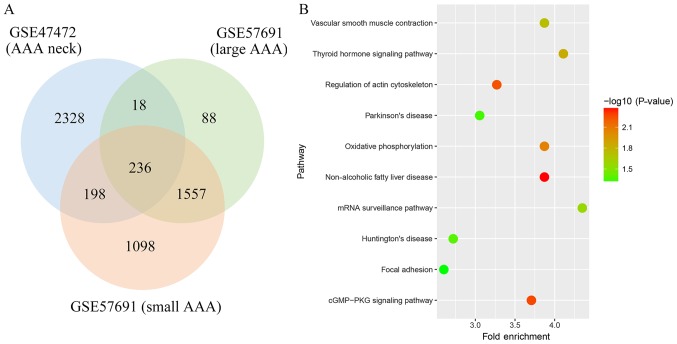
Figure 1.
Bioinformatic analysis: (A) Identification of common differentially expressed genes (DEGs) in mRNA expression profiles; (B) Kyoto Encyclopedia of Genes and Genomes enrichment scatter plot of DEGs. The y-axis shows the name of the pathway, and the x-axis represents the Fold Enrichment. The dot color indicates the-log 10 (P-value).

