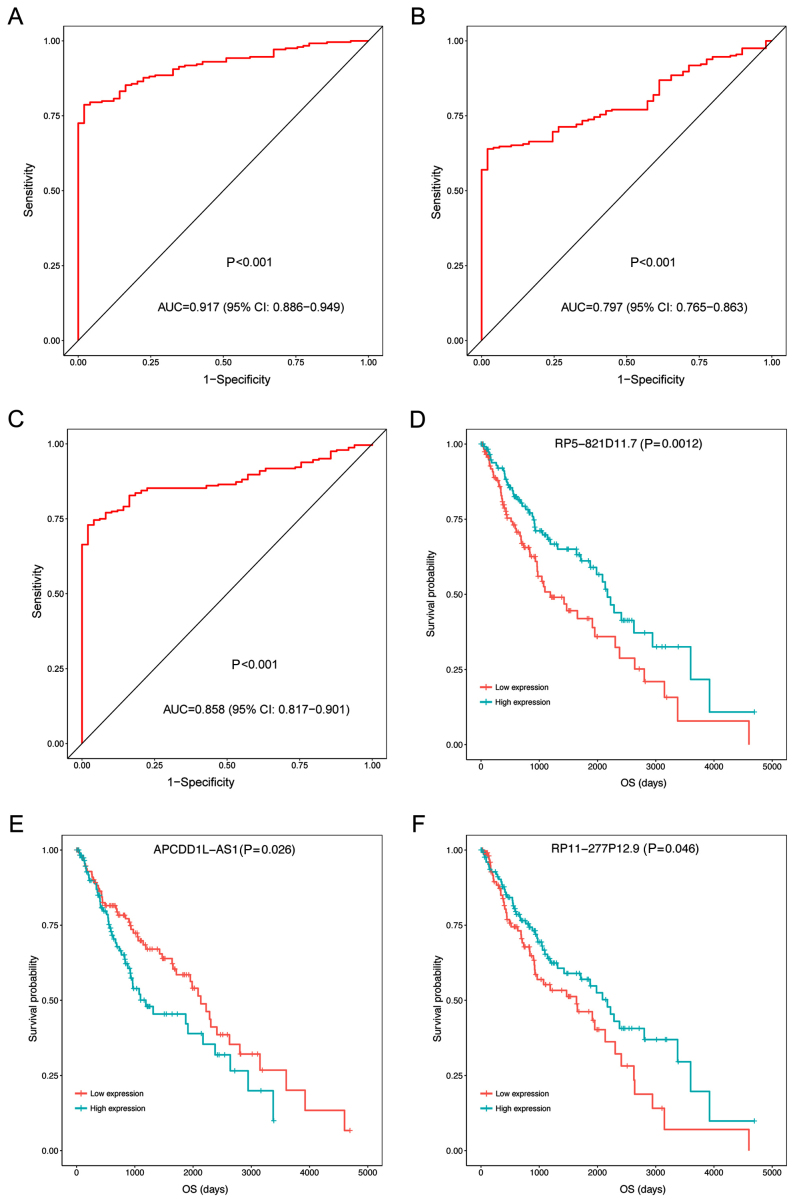
Figure 3.
ROC curves and KM curves of the three prognosis-associated differentially expressed lncRNAs in lung squamous cell carcinoma samples and adjacent samples of the test set. (A) RP5-821D11.7 ROC curve, (B) APCDD1L-AS1 ROC curve, (C) RP11-277P12.9 ROC curve, (D) RP5-821D11.7 KM curve, (E) APCDD1L-AS1 KM curve and (F) RP11-277P12.9 KM curve. AUC, area under the curve; OS, overall survival; CI, confidence interval; ROC, receiver operating characteristic; KM, Kaplan-Meier.

