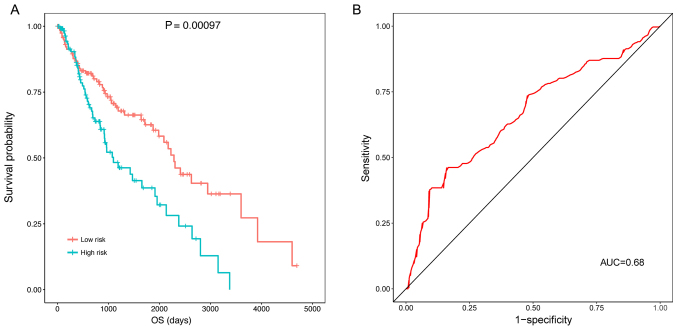
Figure 4.
ROC curves and KM curves of the high and low risk groups classified by the prognostic risk score in the training dataset. (A) KM curve indicating that the samples in the high risk group had a significantly higher OS, and (B) ROC curve demonstrating that prognostic risk scores were able to predict the 5-year survival of patients. AUC, area under the curve; OS, overall survival; KM, Kaplan-Meier; ROC, Receiver operating characteristic.

