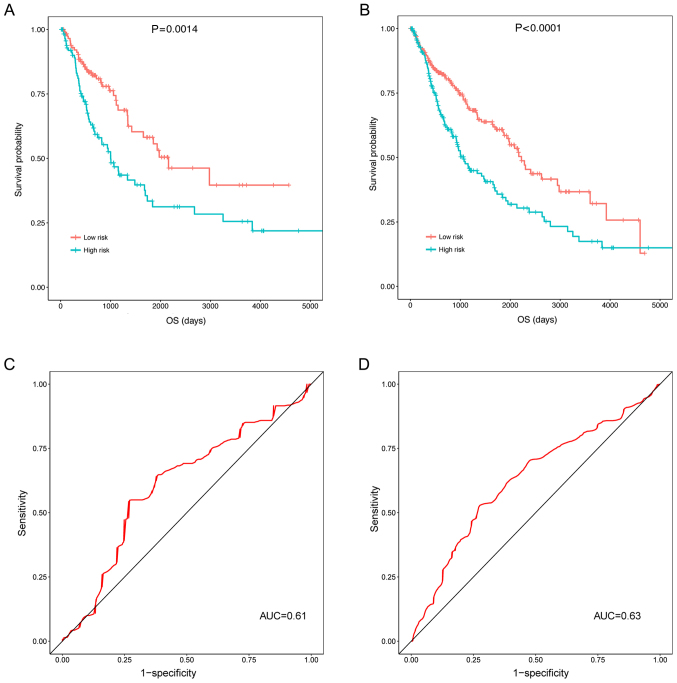
Figure 6.
Assessment of the prognostic values of prognostic risk scores in the validation and universal sets. Kaplan-Meier curves indicating that the OS of patients in the high risk group was significantly decreased for (A) the validation set and (B) the universal set, and receiver operating characteristic curves demonstrating that the three prognosis-associated differentially expressed long non-coding RNAs were able to predict the 5-year survival of patients in (C) the validation set and (D) the universal set. OS, overall survival; AUC, area under the curve.

