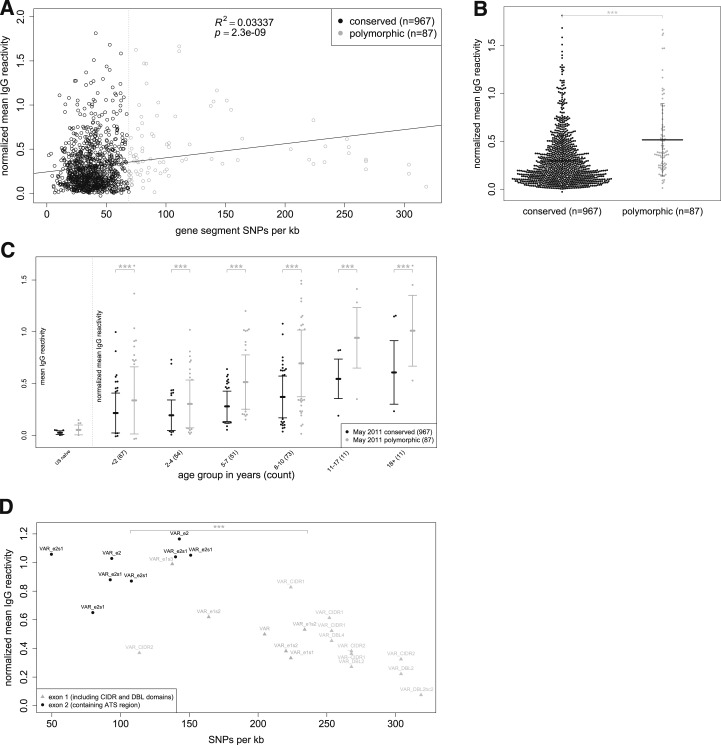
Figure 7.
Immunoglobulin G (IgG) reactivity correlates with degree of protein polymorphism. (A) Scatterplot showing mean IgG reactivity (protein microarray data for 267 subjects) vs. single nucleotide polymorphism (SNPs)/kb for each of 1054 proteins/polypeptides (dots). (B) Mean IgG reactivities to conserved (N = 967) vs. polymorphic proteins (N = 87). Vertical bars represent standard deviation from mean. (C) Mean IgG reactivities to conserved (N = 967) vs. polymorphic proteins (N = 87) stratified by age. (D) Scatterplot showing mean IgG reactivity to P. falciparum erythrocyte membrane protein 1s (PfEMP1s) on the microarray (protein microarray data for 267 subjects) vs. SNPs/kb for each of the PfEMP1s (dots). All data are normalized to mean IgG reactivity of U.S. adults. Scatterplot in (A) fitted to simple linear regression model; comparisons of reactivity in (B) were made using a linear model, in (C) from a linear mixed-effects model, and in (D) with a Welch Two Sample t test. The SNPs/kb were calculated using both synonymous and nonsynonymous SNPs. ****P < 0.0001, ***P < 0.001, **P < 0.01, *P < 0.05, ns = not significant.

