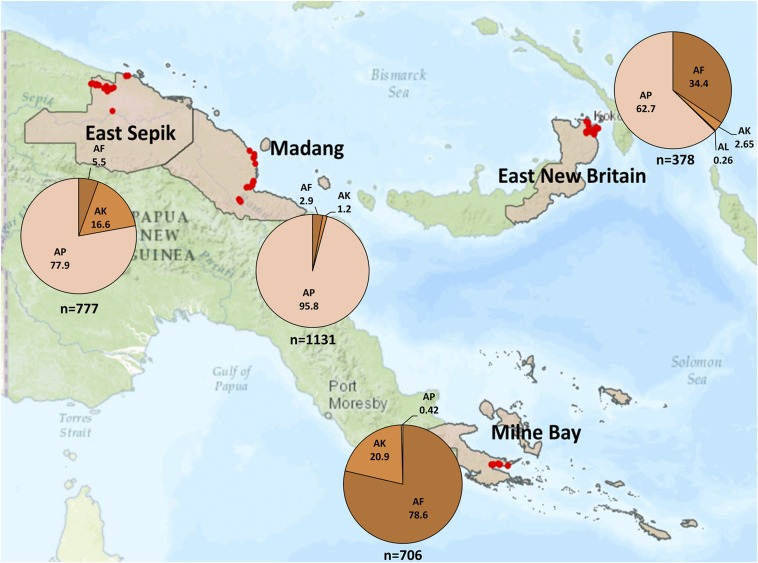
Figure 1.
Map of PNG with study provinces. The collection locations are indicated as dots. The pie charts indicate the distribution (%) and number (n) of mosquitoes subjected to the bioassays in each region. AF = Anopheles farauti; AK = An. koliensis; AL = An. longirostris; AP = An. punctulatus. This figure appears in color at www.ajtmh.org.

