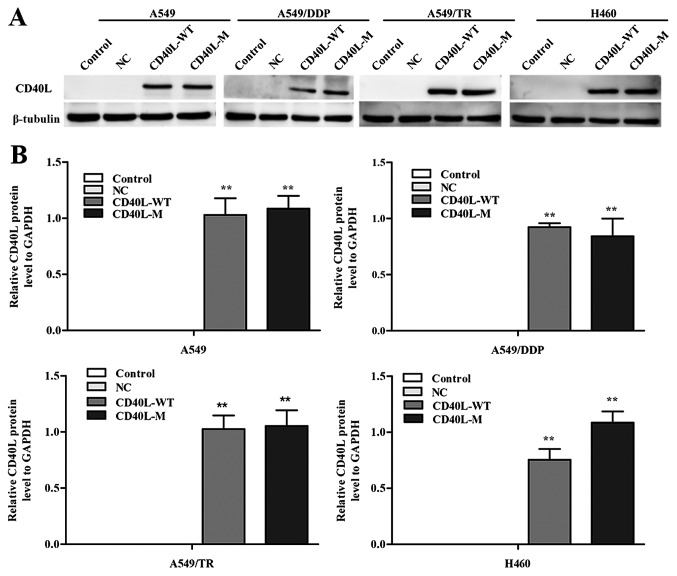
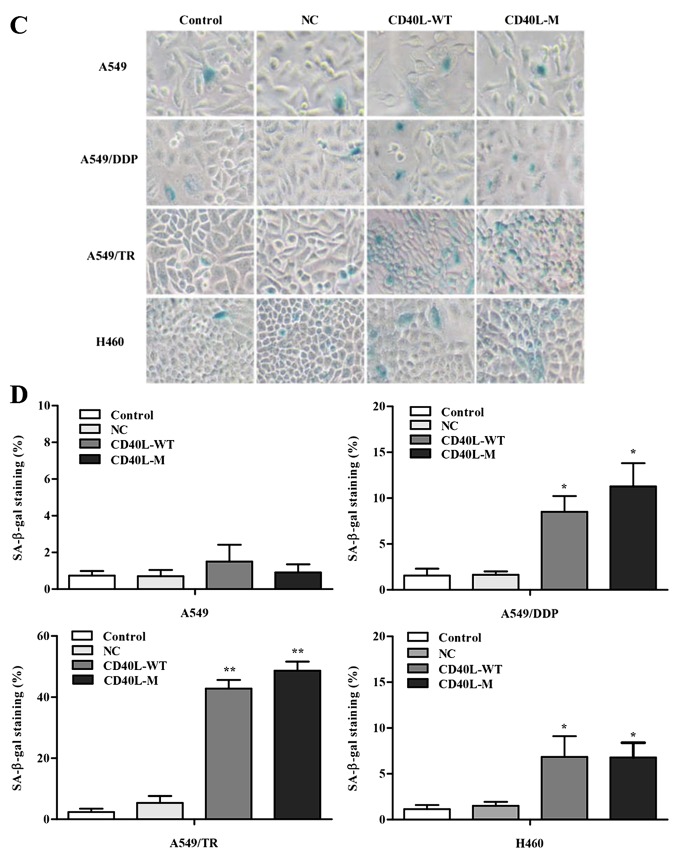
Figure 1.
Expression of CD40L-M induces cellular senescence. (A) CD40-positive NSCLC A549, A549/TR, A549/DDP and H460 cell lines were transfected as indicated and CD40L protein was measured using western blot analysis and (B) quantified with densitometry, respectively. β-tubulin was used as a loading control. (C) Representative imageas of SA-β-gal staining and (D) the percentage of SA-β-gal-positive cells. Data are expressed as the means ± SD of three independent experiments. *P<0.05, **P<0.01 compared to the controls or negative group.


