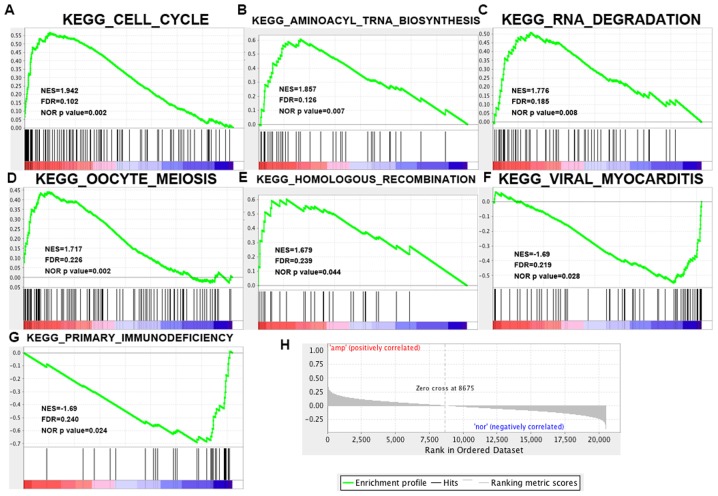
Figure 6.
Gene expression profiling identifies pathways upregulated from the TCGA bladder cancer database (provisional). (A-G) The 7 significantly enriched gene sets in bladder cancer. The normalized enrichment score, the false discovery rates (FDR) and the nominal P-value score (NES) are indicated for each gene set. Each bar at the bottom of each panel represents a member gene of the respective pathway from plot A-G and (H) shows its relative location in the ranked list of genes. TCGA, The Cancer Genome Atlas.

