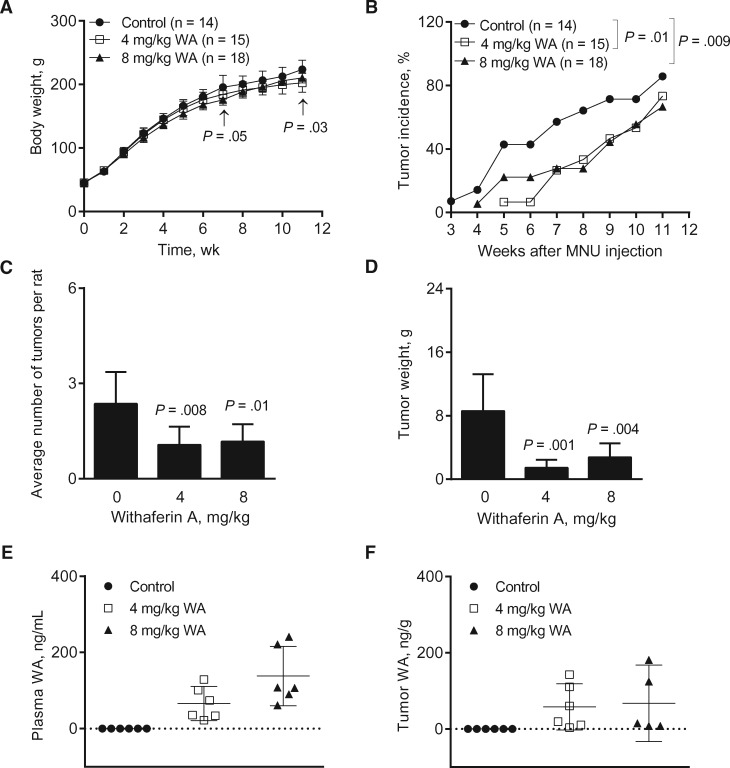
Figure 1.
Effect of Withaferin A (WA) administration on N-methyl-N-nitrosourea (MNU)-induced mammary tumor development in female Sprague-Dawley rats. A) Body weight of the rats over time of the control and the WA treatment groups. Results shown are mean body weights with their 95% confidence intervals (error bars, n = 14 for control; n = 15 for 4 mg/kg; n = 18 for 8 mg/kg, except on week 11 where n = 11 for control; n = 12 for 4 mg/kg; n = 15 for 8 mg/kg). Statistical significance of difference was analyzed by Dunnett’s test. B) Tumor incidence over time (palpable tumors) in rats administered with either vehicle or WA (4 or 8 mg/kg). Results shown are percentage of tumor incidence over time in control and WA treatment groups (n = 14 for control; n = 15 for 4 mg/kg; n = 18 for 8 mg/kg except on week 11, where n = 11 for control; n = 12 for 4 mg/kg; n = 15 for 8 mg/kg). The generalized linear mixed model was performed to examine the difference of the percentage or probability of tumor presence between the groups. C) Average number of tumors per rat (tumor multiplicity) in control and WA treatment groups. Results shown are the average number of tumors per rat with their 95% confidence intervals (error bars, n = 14 for control; n = 15 for 4 mg/kg; n = 18 for 8 mg/kg). Statistical significance was determined by Poisson regression model. D) Tumor weight in rats of control and WA treatment groups. Results shown are mean tumor weight with their 95% confidence intervals (error bars, n = 14 for control; n = 15 for 4 mg/kg; n = 18 for 8 mg/kg). Statistical significance was determined by Dunnett’s test. E) WA concentration in the plasma of control- and WA-treated rats. The lines in the scatter dot plot indicate mean WA levels and their 95% confidence intervals (error bars, n = 6 for all groups). Plasma specimens from different rats of each group were used for determination of WA levels. F) WA concentration in the tumor of control- and WA-treated rats. The lines in the scatter dot plot indicate mean WA levels and their 95% confidence intervals (error bars, n = 6 for control and 4 mg/kg; n = 5 for 8 mg/kg). Tumor tissues from different rats of each group were used for determination of WA levels. All P values were two-sided.

