Figure 2.
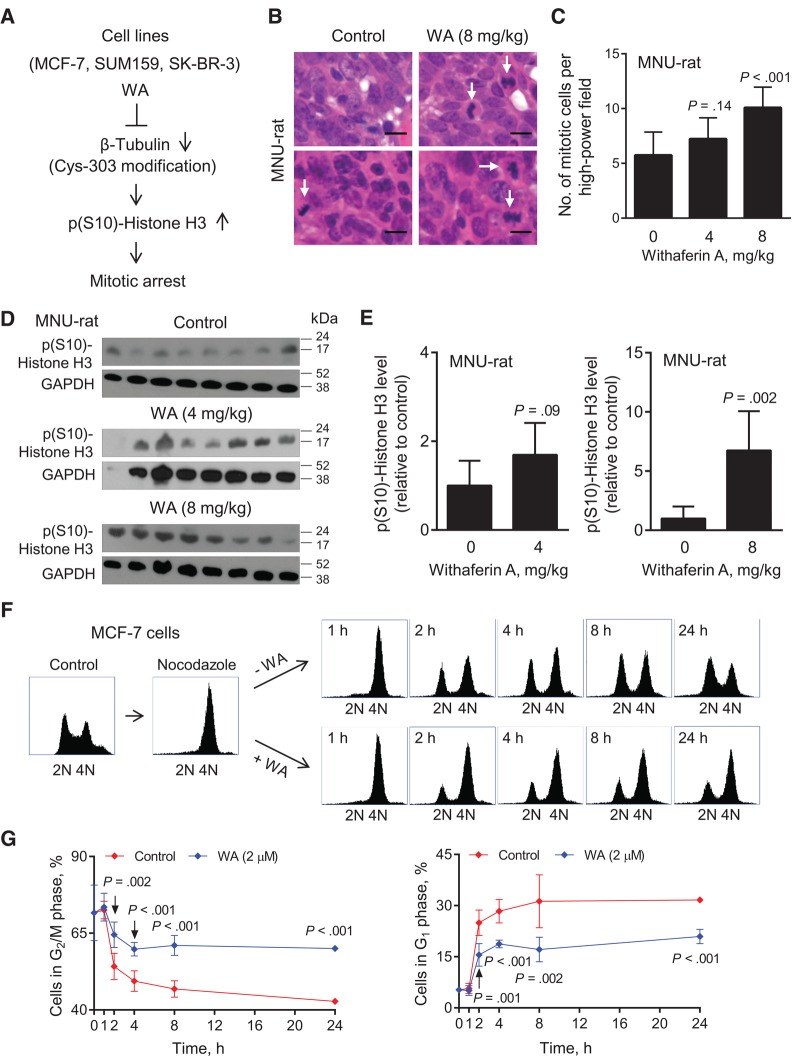
Effect of Withaferin A (WA) treatment on mitotic fraction in vivo in rat tumors and in MCF-7 cells in vitro. A) A schematic showing the mechanism underlying WA-mediated mitotic arrest in human breast cancer cell lines. B) Representative hematoxylin and eosin–stained mammary tumor sections from two different rats of each group (control and 8 mg/kg WA) showing mitotic cells (identified by arrows; ×400 magnification, scale bar = 10 μm). C) Quantitation of mitotic cells in mammary tumor sections of control- and WA-treated rats. Results shown are mean number of mitotic cells per high-power field with their 95% confidence intervals (error bars, n = 12 for control; n = 11 for 4 mg/kg; n = 12 for 8 mg/kg). Tumor sections from different rats of each group were used for quantitation of mitotic cells. Statistical significance of difference was analyzed by Dunnett’s test. D) Immunoblotting for p(S10)-Histone H3 and GAPDH using tumor lysates from control- and WA-treated rats. Each lane represents tumor lysate from a different rat of each group. E) Quantitation of p(S10)-Histone H3 protein in tumor lysates from control- and WA-treated rats. Results shown are p(S10)-Histone H3 level relative to control with their 95% confidence intervals (error bars, n = 8 for control; n = 7 for 4 mg/kg; n = 8 for 8 mg/kg). Statistical significance of difference was analyzed by unpaired Student’s t test. F) Representative flow histograms showing synchronization of MCF-7 cells in the G2/M phase (4N) by treatment with nocodazole, and subsequent exit from mitosis (evidenced by a decrease in 4N G2/M population) and resumption of cell cycle progression (evidenced by an increase in 2N G1 population) at different time points after release of the synchronized cells in drug-free medium or medium containing 2 μM WA. G) Percentage of cells in G2/M phase (left panel) or G1 phase (right panel) for data shown in (F). The experiment was done in triplicate three times independently, and the results were consistent. Data shown are mean percentage of cells in respective phase with their 95% confidence intervals (error bars, n = 3 for both groups). Statistical significance of difference was analyzed by unpaired Student’s t test. All P values were two-sided.

