
Figure 2.
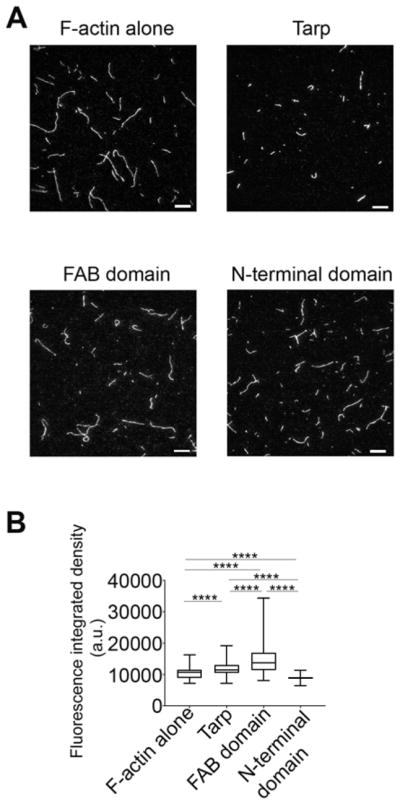
Tarp produces actin structures which have higher fluorescence intensities compared to actin filaments alone as determined by TIRF microscopy image analysis. (A) Representative TIRF images of rhodamine-labeled actin filaments or bundles assembled with Tarp or Tarp mutant proteins (Scale bar 10 μm). (B) Cumulative fluorescence integrated density of actin structures in the presence or absence of Tarp or mutant Tarp proteins plotted in a Box and Whiskers graph using GraphPad prism version 7.04 where the ends of the whiskers represent the minimum and maximum of the cumulative data. One-way ANOVA with Tukey’s multiple comparison test was used. **** represents p<0.0001.