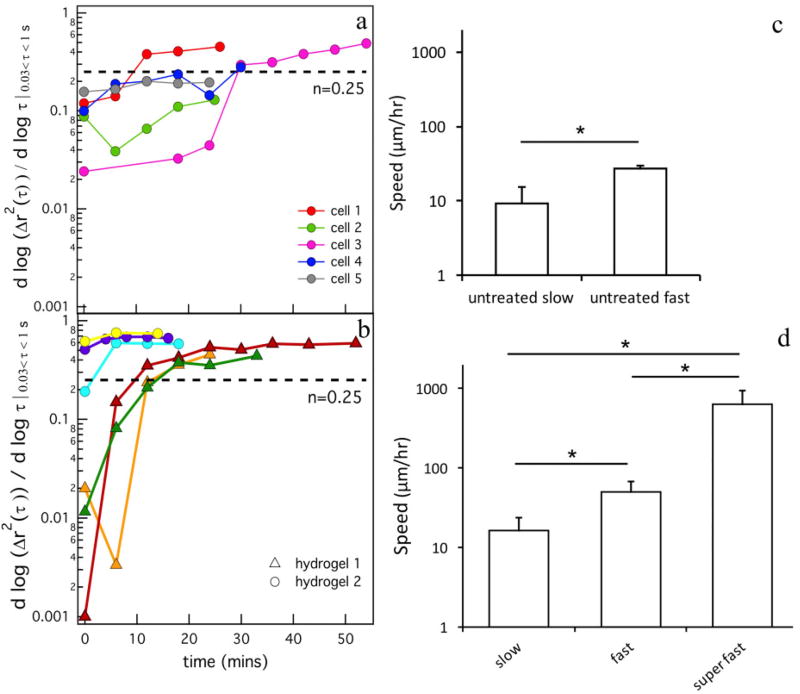
Fig. 4.
Changes in the logarithmic slope of mean-squared displacement, , over time for cell-laden hydrogels for (a) untreated hMSCs and (b) TIMP inhibited hMSCs. Dashed lines in both graphs (a, b) indicate the critical relaxation exponent, n, that quantitatively determines the transition from a gel to a sol. Each line represents changes in the α value throughout time around a single encapsulated hMSC. The colors on the graph represent data around different hMSCs. Two separate hydrogels are shown in (b) indicated by the –△– and –○– symbols. The average migration speed of hMSCs for (c) untreated hMSCs and (d) TIMP inhibited hMSCs. The cell speed increased significantly after TIMP inhibition, *p < 0.05.

