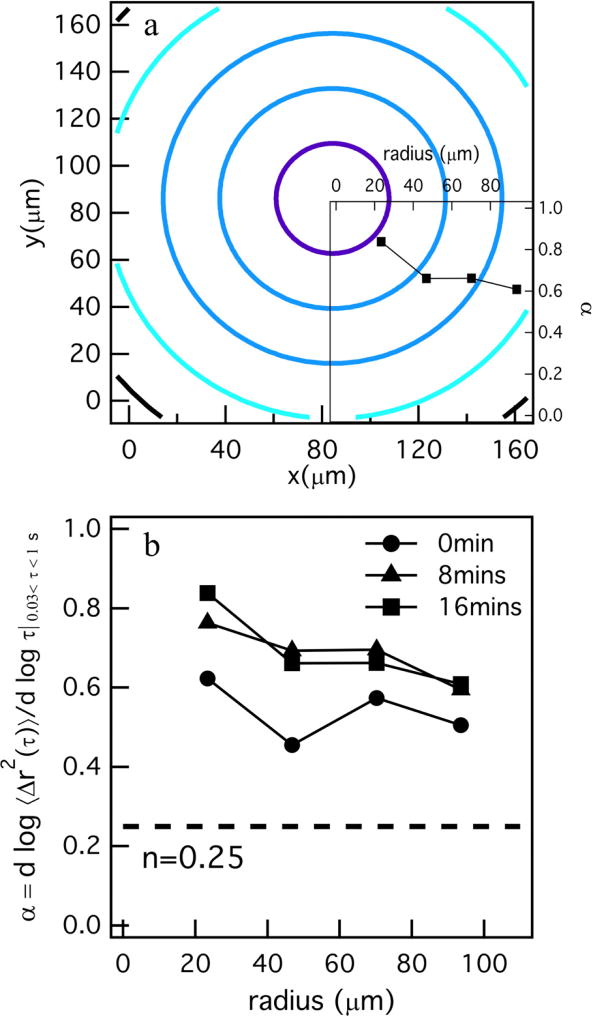
Fig. 6.
Spatial degradation profiles around an encapsulated hMSC treated with TIMP–1 and –2 antibodies. a) Profile of degradation at 16 minutes with the logarithmic slope of mean-squared displacement, , versus distance away from the cell center graph overlaid. α is decreasing as the distance from center of the cell is increasing. b) α versus distance from the cell center for different times during MPT data acquisition in the pericellular region for a TIMP inhibited hMSC. This plot is showing the same decreasing trend in α for all different time point of data acquisition. The complete degradation profile around this hMSC is added as Figure 8S in the ESI†.

