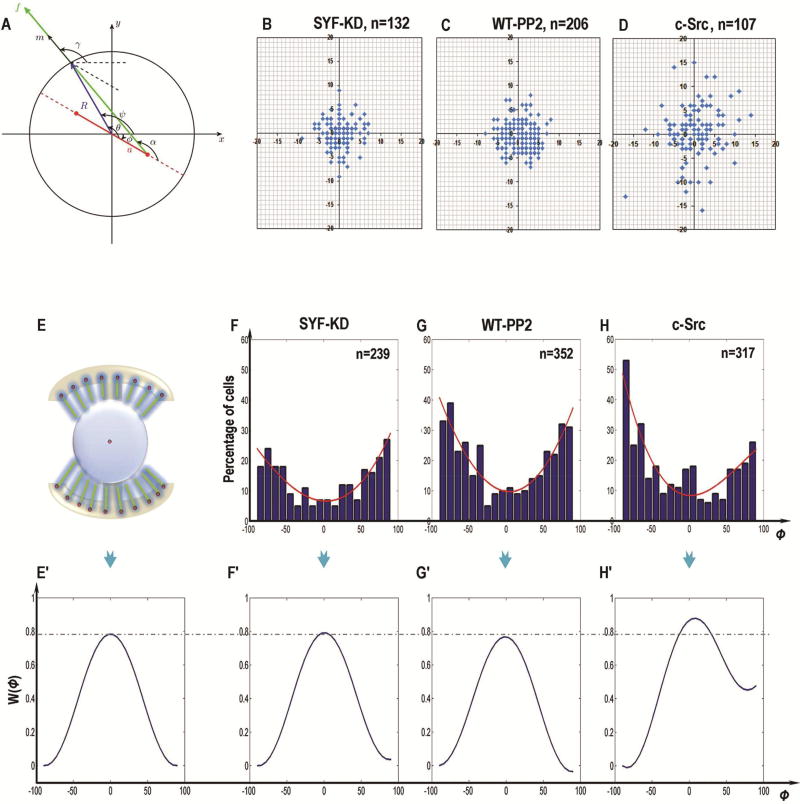
Figure 6. Experimental study of Src-induced cell division orientation.
(A) Schematic representation of mitotic spindle geometry for round cells with radius R. The spindle poles (red) are separated by distance 2a. The spindle orientation is characterized by angle ϕ(0, π/2) between the x -axis and the spindle axis. The cortical angle of each pulling force on the cell cortex is denoted by ψ(ϕ, ϕ+π).
(B–D) The center positions of the dividing cells in SYF-KD (B), PP2-treated WT-MEF (C, WT-PP2) and c-Src-overexpressing (D) cells. In the rounding cells, the center positions of SYF-KD and PP2-treated WT-MEF cells were close to the pattern center (B, C). When Src was activated, however, the cell center during division scattered and changed away from the pattern center (D).
(E, E’) The schematic representation to show mitotic cell on I-type micropattern with uniform distribution of adhesive molecules (top, E), and the ideal energy profile W(ϕ) theoretically (bottom, E’), where the variation measured from the pattern center is not taken into consideration.
(F–H) Angular distributions of spindle orientation in SYF-KD (F), PP2-treated WT-MEF (G) and c-Src-overexpressing (H) cells were experimentally measured on the “I”-type micropattern during mitosis. The outlines which fit the angular distribution histogram obtained from the experimental data were indicated (red line).
(F’–H’) The schematic representations to show the theoretical potential energy landscape W(ϕ) in SYF-KD (F’), PP2-treated WT-MEF (G’) and c-Src-overexpressing (H’) cells.

