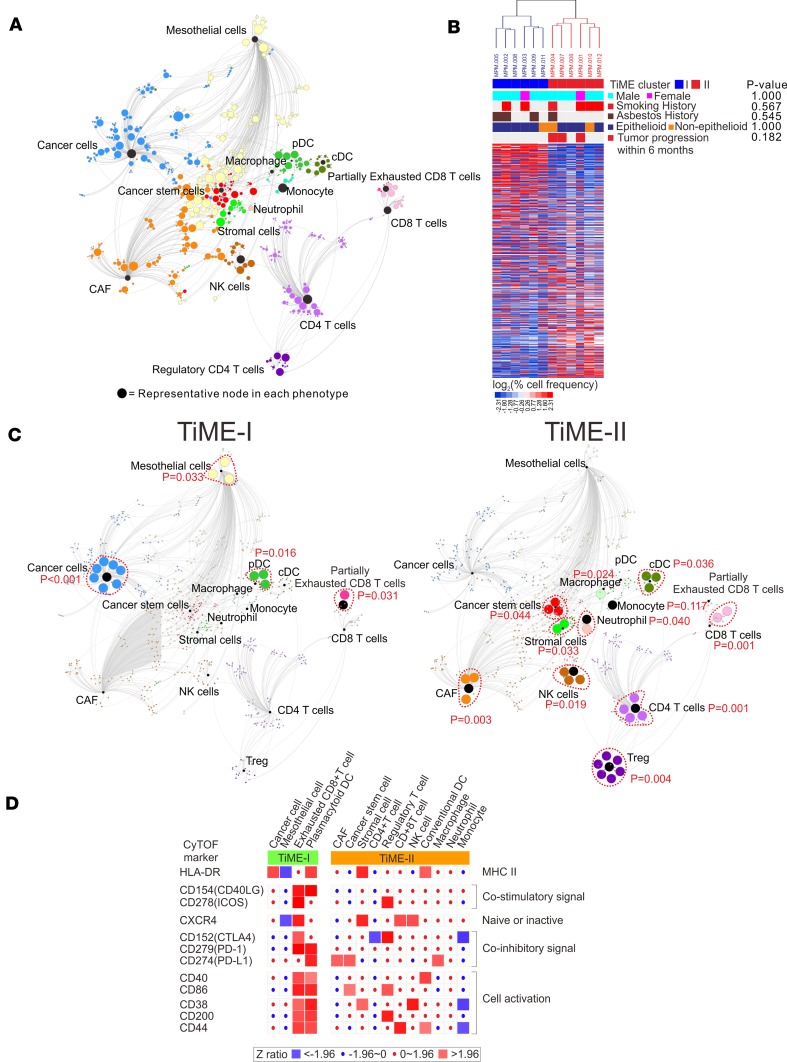
Figure 2. SCAFFOLD maps of tumor immune microenvironment (TiME) in MPM.
(A) A SCAFFOLD map of TiME in 12 human MPM tumors. CyTOF was performed on 12 MPM tumors utilizing a panel of 35 metal-conjugated antibodies. Pooled data from these 12 patients was used to generate a SCAFFOLD reference map of MPM’s intratumoral immune system. This approach provides a data-driven representation of cellular networks, while also denoting the location of landmark immune cell populations defined using prior knowledge of the immune system. For example, landmark nodes are visualized as black nodes and represent 15 manually defined major cellular phenotypes. The same cells are subjected to unsupervised clustering to provide an objective view of cell composition and organization, and 742 cellular subpopulations were identified and represented by the colored nodes. In these maps, node size represents the relative number of cells in that grouping, and line length indicates similarity between cells. In other words, 2 groups of cells are connected by a short line if the proteins they express are relatively similar, and a longer line if they are relatively disparate. (B) Two distinct subsets of MPM patients were identified by unsupervised clustering of pooled CyTOF data from 12 MPM tumors: 6 tumors of the TiME-I subset and 6 tumors of the TiME-II subset. (C) The SCAFFOLD maps of TiME-I and TiME-II subsets. SCAFFOLD maps were generated from pooled data from the 6 patients in each of the TiME-I and -II immunologic subsets of MPM, and cellular subpopulations were statistically compared between each subset. The internodal differences in the same phenotypes were analyzed with 2-tailed paired t test according to the corresponding nodes. (D) Differential activation states of the immune cell populations between TiME-I and TiME-II MPM tumors. Immune stimulatory or inhibitory markers were significantly altered between 2 TiME subsets. Z ratios were calculated by taking the difference between the averages of the observed marker Z scores and dividing by the SD of all the differences for that particular comparison. A Z ratio of ±1.96 was inferred as significant (P < 0.05). CAF, cancer-associated fibroblast; cDC, conventional DCs; CyTOF, time-of-flight mass cytometry; MPM, malignant pleural mesothelioma; pDC, plasmacytoid DCs; SCAFFOLD, single-cell analysis by fixed force– and landmark-directed; TiME, tumor immune microenvironment; and Treg, CD4+ Tregs.

