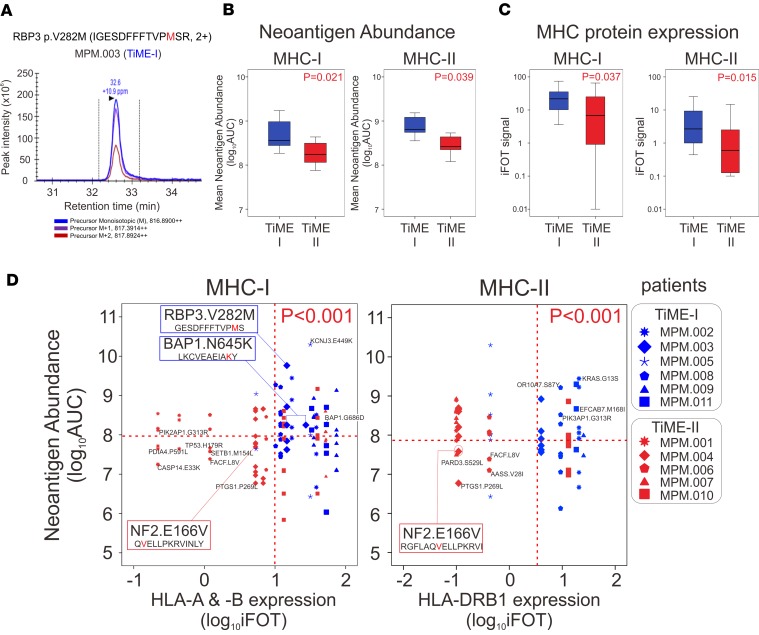
Figure 3. Neoantigen abundance and corresponding MHC molecules between 2 distinct TiME subsets.
(A) Direct identification of neoantigen abundance of IGESDFFFTVPMSR of RBP3V282M by mass spectrometry. Triple-redundant peaks of monoisotopic 12C, 13C (M+1), and 14C (M+2) support that the identified peaks for the peptides are accurately made. (B) Mean neoantigen abundance of directly identified neopeptides for MHC-I and MHC-II was determined by mass spectrometry on 11 MPM tumors (n = 6 TIME-I and n = 5 TiME-II). The 2-tailed Student’s t tests were used to compare the data. (C) MHC-I and MHC-II protein expression was determined by mass spectrometry on 11 MPM tumors. The 2-tailed Student’s t tests were used to compare the data. (D) Two-dimensional plots between abundance of neopeptides with high affinity to HLA-A, HLA-B, and HLA-DRB1 and the expression of the specific corresponding MHC molecules, on 11 MPM tumors. The 2-tailed χ2 tests were used to compare the data. BAP1, BRCA1 associated protein 1; iFOT, fraction of total intensity based absolute quantification; MHC, major histocompatibility complex; MPM, malignant pleural mesothelioma; NF2, neurofibromin 2; RBP3, retinol binding protein 3; and TiME, tumor immune microenvironment.

