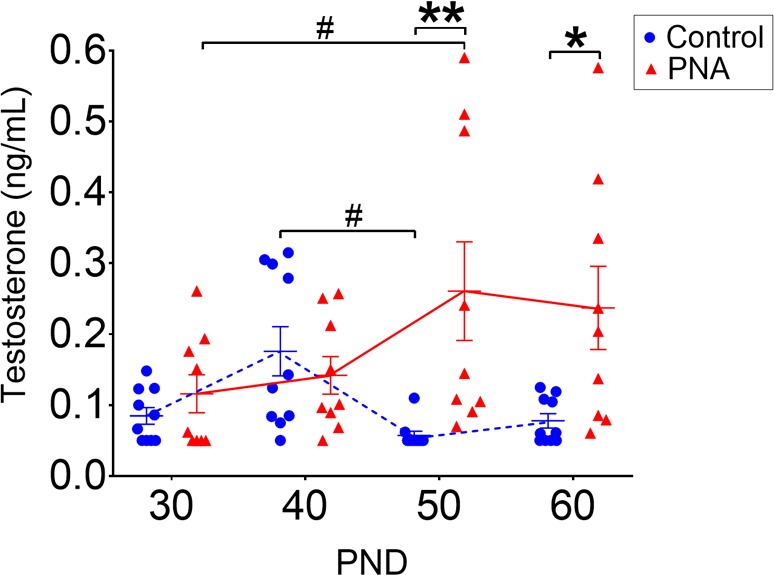
Figure 1. Androgen excess in PNA mice develops by PND 50.

Circulating testosterone levels from postnatal day (PND) 30 to PND 60 in control (N = 10) and prenatally androgenized (PNA) (N = 9) mice. Data are shown as dot plots for each time point and bars represent mean ± SEM. Dashed blue lines indicate testosterone levels of control mice and red full lines indicate PNA mice. Differences between the groups are reported as *P < 0.05; **P < 0.01 and differences within each groups are reported as #P < 0.05. Data analysis was performed with repeated-measures 2-way ANOVA with Sidak’s post hoc test.
