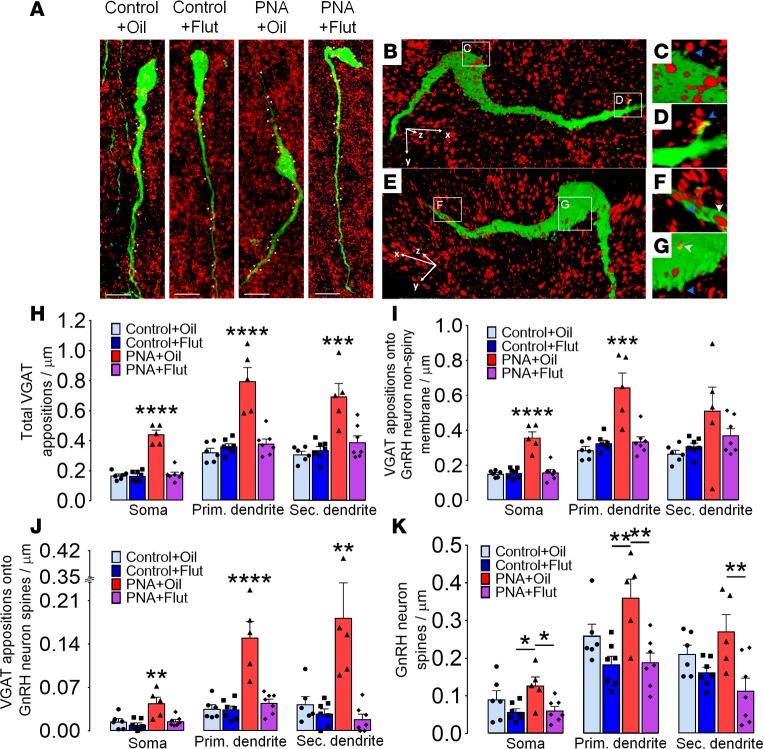
Figure 3. Blockade of androgen receptor (AR) signaling reverses GABA-to-GnRH circuit abnormalities in adult PNA mice.
(A) Confocal images of adult diestrus control and prenatally androgenized (PNA) mice showing GnRH-GFP neurons (green) and vesicular GABA transporter–immunoreactive (VGAT-ir) contacts representing GABA inputs (red puncta) in the rostral preoptic area. Red puncta (VGAT-ir) in close apposition to green GnRH neurons can appear as yellow or with a yellow halo as a result of overlap in confocal projections. White arrowheads indicate putative GABAergic inputs to GnRH neurons. Scale bars: 10 μm. (B and E) Projected 3D reconstruction of a GnRH-GFP neuron from an adult PNA mouse illustrating VGAT-ir puncta contacts, with white arrowheads indicating VGAT contact onto non-spiny GnRH neuron membrane, and blue arrowheads indicating inputs onto somatic and dendritic spines. Rotated and zoomed inset images of VGAT contact with a somatic spine (C), front and back views of dendritic spines in the distal dendrite covered with GABA inputs (D and F), and VGAT contacts onto the proximal dendrite of a GnRH neuron (G). (H) Total VGAT-ir density on GnRH neurons of control+oil (N = 6; 61 neurons), control+Flut (N = 7; 72 neurons), PNA+oil (N = 5; 53 neurons), and PNA+Flut (N = 7; 72 neurons) groups. VGAT appositions are shown for each neuronal compartment. (I) Total VGAT apposition density onto non-spiny GnRH neuron membrane. (J) Total VGAT-ir apposition density onto GnRH neuron spines. (K) Number of GnRH neuron spines. Histogram values are represented by mean ± SEM with dot plots of individual values. *P < 0.05; **P < 0.01; ***P < 0.001; ****P < 0.01; 2-way ANOVA with Tukey’s post hoc test. Flut, flutamide; GnRH, gonadotropin-releasing hormone.

