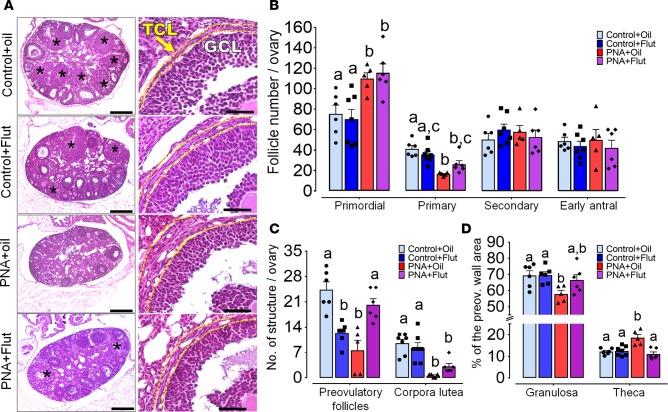
Figure 5. Androgen receptor (AR) blockade improves the recruitment of preovulatory follicles and their features in PNA mice.
Ovarian morphology of adult control and prenatally androgenized (PNA) mice undergoing s.c. injection with oil-vehicle or flutamide (Flut) 25 mg/kg/day from postnatal day (PND) 40 to PND 60. (A) First column: 5-μm-thick ovarian sections from control and PNA mice in diestrus. Corpora lutea are indicated by black asterisks. Scale bars: 500 μm. Second column: representative images of a preovulatory follicle wall from each group; yellow dashed lines delineate the theca cell layer (TLC) from granulosa cell layer (GCL). Scale bars: 50 μm. (B) Total number of primordial, primary, secondary, and antral follicles. (C) Total number of preovulatory follicles and corpora lutea. (D) Percentage of the follicle wall area made up of GCL and TLC from the largest preovulatory follicle. Different letters indicate significant statistical differences with P < 0.05; 2-way ANOVA followed by Tukey’s post hoc test. Histograms show mean ± SEM data from control+oil (N = 6), control+Flut (N = 7), PNA+oil (N = 5), and PNA+Flut (N = 6) groups.

