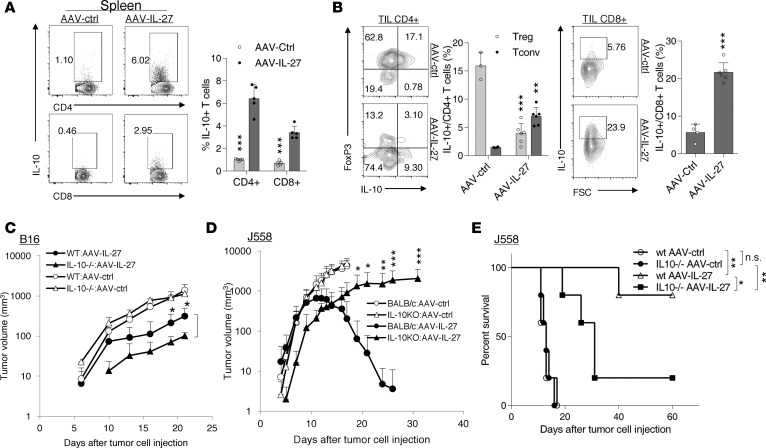
Figure 8. The role of IL-10 in AAV–IL-27–mediated antitumor activity.
(A and B) B16.F10 cells (2 × 10⁵) were injected into C57BL/6 mice s.c. Four days later, mice were treated with AAV–IL-27 or AAV-ctrl virus i.m. at a dose of 2 × 10¹¹ DRP/mouse. Percentages of IL-10+ CD4+ and CD8+ T cells in spleen (A) and tumors (B) were quantified by flow cytometry. Data are expressed as mean ± SEM and represent at least 5 experiments with similar results. **P < 0.01, ***P < 0.001 by Student’s t test. (C) B16.F10 cells (2 × 10⁵) were injected into C57BL/6 and IL10–/–C57BL6 mice s.c. Four days later, mice (n = 5/group) were treated with AAV–IL-27 or AAV-ctrl virus i.m. at a dose of 2 × 10¹¹ DRP/mouse. Data are expressed as mean ± SEM and represent 2 experiments with similar results. *P < 0.05 by one-way ANOVA test. (D and E) J558 cells (5 × 10⁶) were injected into BALB/c and IL10–/–BALB/c mice s.c. Four days later, mice (n = 5/group) were treated with AAV–IL-27 or AAV-ctrl virus i.m. at a dose of 2 × 10¹¹ DRP/mouse. Tumor volumes (D) and mice survival (E) were observed. Data are expressed as mean ± SEM and represent 2 experiments with similar results. *P < 0.05, **P < 0.01, ***P < 0.001 by 1-way ANOVA (C and D) or log-rank test (E).

