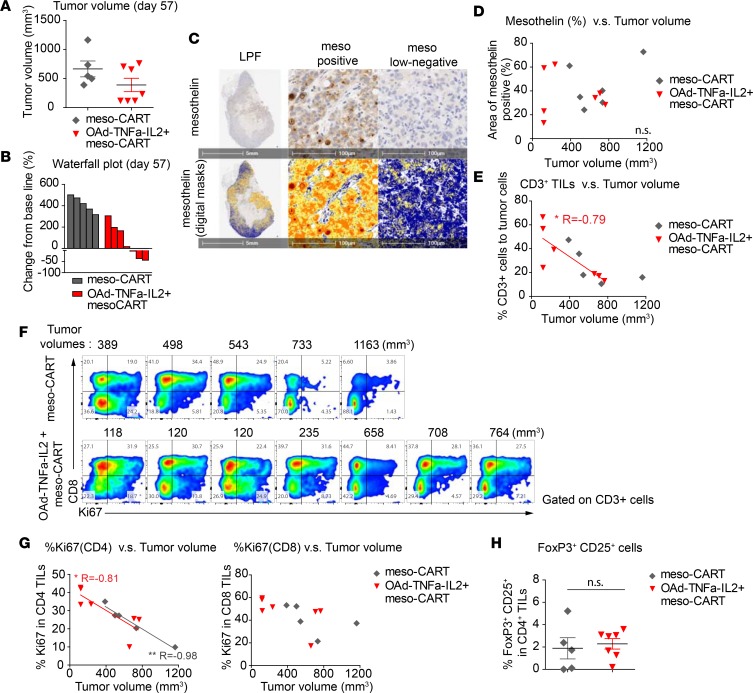
Figure 5. Intensity of functional T cell infiltration is associated with sustained tumor regression after mesothelin-redirected chimeric antigen receptor T cells (meso-CAR T cells) and oncolytic adenovirus expressing TNF-α and IL-2, Ad5/3-E2F-D24-TNFa-IRES-IL2 (Ad5/3-OAd-TNFa-IL2) treatment in an AsPC-1 tumor xenograft immunodeficient mouse model.
(A and B) Tumor volumes by caliper measurements and waterfall plots comparing baseline to day 57. Mice from the indicated 2 treatment groups were observed until day 57 and then sacrificed. Data for the surviving mice (6 of 8 mice for meso-CAR T cell group and all 7 mice for OAd-TNFa-IL2 + meso-CAR T cell group) is shown. Bars represent means and SEM in A. (C) Mesothelin expression on tumors at day 57. Mesothelin expression of the representative tumor from OAd-TNFa-IL2 + meso-CAR T cell group by immunohistochemistry (IHC) (upper panels) and digital masks (lower panels) on the same fields as upper panels are shown. The low-power fields (LPFs) show central necrosis and heterogeneity in mesothelin intensity (left panels). Representative high-power fields (HPFs) of mesothelin-positive area (center panels) and mesothelin low-negative area (right panels) from the tumor shown in the LPF. Blue, negative; Yellow, low intensity; Orange, mid intensity; Red, high intensity. Original magnification, ×20. Scale bars: 5 mm for LPF, 100 μm for HPF. (D) Correlation between mesothelin expression and tumor size at day 57. Areas of mesothelin positivity (%) against tumor volumes are plotted. n.s., not significant. (E) Correlation between CD3+ tumor-infiltrating lymphocyte (TIL) density and tumor volumes. Percentage CD3+ cells to tumor cells against tumor volumes are plotted. A linear regression line is shown. *P < 0.05. (F) Expression of Ki67 by TILs. Ki67 expression by CD3+ TILs from surviving mice was analyzed by flow cytometry (FCM). Columns are arranged in the order of tumor volumes at day 57 and the tumor sizes are shown at the top of each column. (G) Correlation between Ki67 expression by CD4+ and CD8+ TILs and tumor volumes. Percentage Ki67 expression by CD4+ TILs or CD8+ TILs against tumor volumes are plotted. Linear regression lines are shown. *P < 0.05, **P < 0.01. (H) Analysis of Treg infiltration into the tumor. CD25+FoxP3+ Tregs in CD4+ TILs were analyzed by FCM. Bars represent means and SEM. n.s., not significant by Student’s t test.

