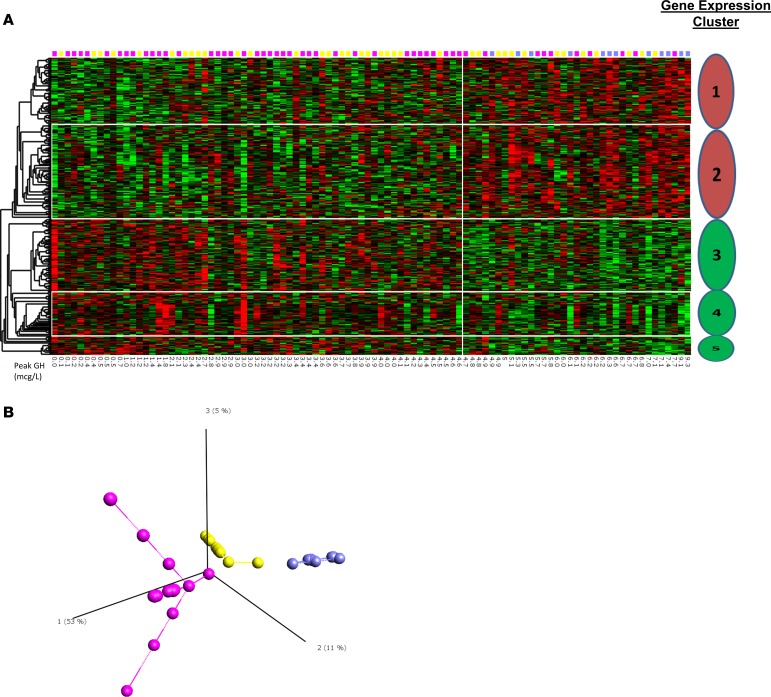
Figure 2. Identification of clusters of variation of gene expression related to GHD severity.
(A) Heatmap for the probe sets identified by correlation with peak GH (347 probe sets, 271 unique genes). Five distinct clusters of gene expression are identified via the dendrogram — two positively correlated (red) with peak GH and three negatively correlated (green). Pink, yellow, and blue squares indicate the principal component analysis group for each patient (see Figure 1B). (B) Isomap supervised principal component analysis using only those probe sets whose expression correlated to peak GH identified 3 distinct groups of GHD subjects (n = 98; pink n = 49, yellow n = 37, and blue n = 12).

