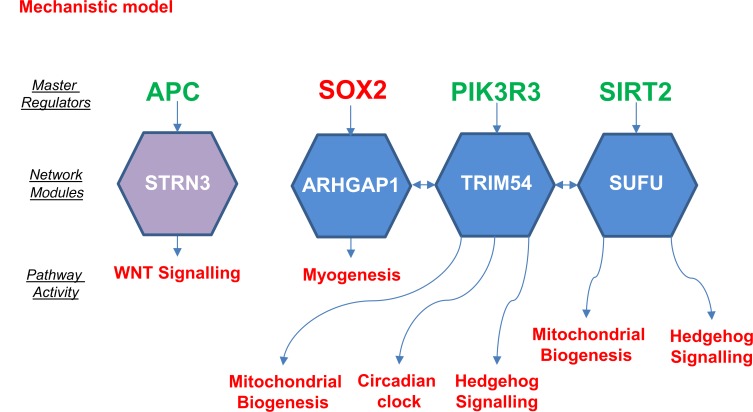
Figure 4. Summary of predicted activity and regulators derived via causal network analysis for the network modules.
The hierarchy of clusters of gene expression shown in Figure 2 were mapped onto identified causal networks. Activity of pathways and master regulators (colored red) show a positive correlation with the GHD severity or (colored green) show negatively correlated activity. Pathway ontology of all modules in the hierarchy is shown in Supplemental Figure 2.

