Figure 6.
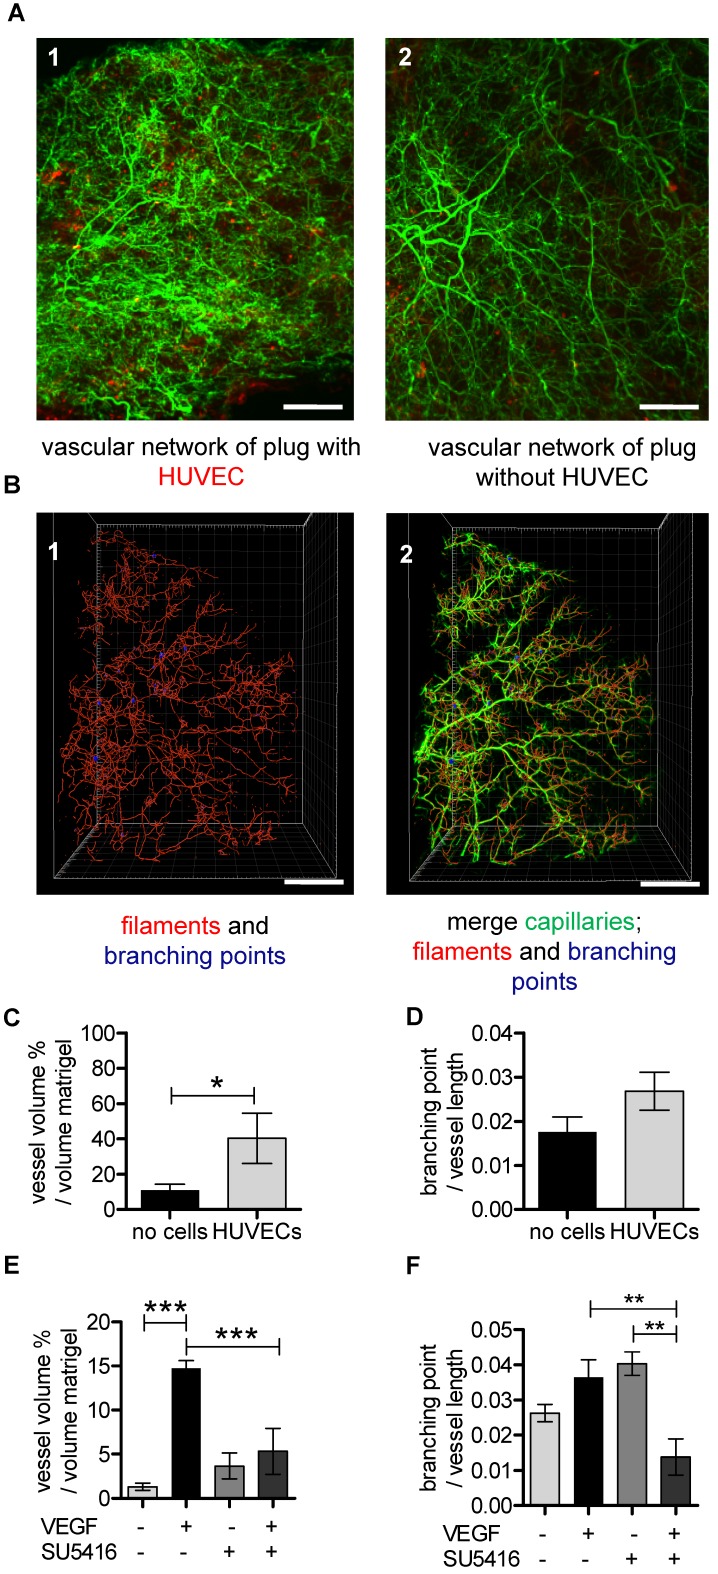
UM-based visualization and quantification of the vascular network in matrigel plugs. (A-D) HUVECs stained with Vybrant DiI (red) were embedded in matrigel (A1) and cell-free matrigel (A2) and injected into SCID mice. Red dots in cell-free matrigel (A2) are false positive signals. Isolectin GS-IB4 A647 conjugate-stained vessels are in green. (B1) A quarter of the Isolectin GS-b4 Alexa 647-stained vascular network is shown and was analyzed by detecting filaments (red) and branching points (blue). (B2) The vascular network and the created filaments and branching points were merged. Scale bar represents 500 µm. (C-D) Analysis of vessel volume in percent per volume of matrigel plug or branching points per vessel length with and without HUVECs. Data are shown as mean ± SEM (n=4). Unpaired student´s T-test was used. (E) VEGF (200 ng/mL) and VEGF-free matrigels were injected in C57BL/6 mice. (E-F) C57BL/6 mice were treated with (n=3) or without (n=4) VEGF receptor antagonist SU5416. Data are shown as mean ± SEM. One-way ANOVA followed by Newman-Keuls post-hoc test was used; **p<0.01, ***p<0.001. HUVEC: human umbilical vein endothelial cell; VEGF: vascular endothelial growth factor.

