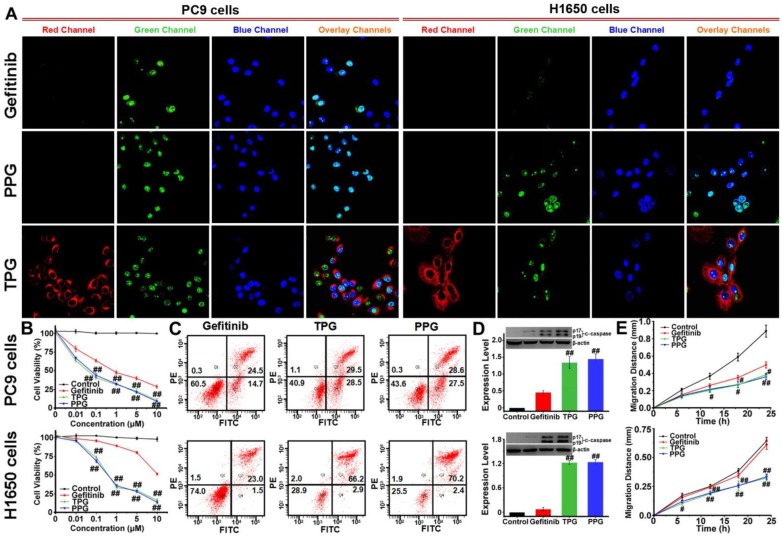
Figure 1.
Antitumor imaging and efficacy of TPG and PPG in NSCLC cells. (A) Fluorescence imaging of apoptosis in PC9 and H1650 cells. The cells were treated with 1 μM Gefitinib, TPG, or PPG (red channel: λex/em = 635/670-770 nm) for 24 h, co-stained with Hoechst 33258 (blue channel: λex/em = 405/410-490 nm) for 30 min and Caspase-3/7 Green Detection Reagent (green channel: λex/em = 488/500-570 nm) for 1 h and examined by confocal laser scanning microscopy (n = 3 independent experiments). The overlay images are the combination of red, blue and green channels. Bright fields are shown in Supplementary Material. Scale bar: 20 μm. (B) Cell viabilities of PC9 and H1650 cells. The cells were treated with Gefitinib, TPG, or PPG at 0, 0.01, 0.1, 1, 5 or 10 μM for 72 h, and then measured using CCK-8 kit. The error bars shown in the figures represent the mean ± s.d. (n = 6 independent experiments). (C) Apoptosis of PC9 and H1650 cells. Cells were treated with 1 μM Gefitinib, TPG, or PPG at 37°C for 72 h and detected by Annexin V/PI assay with flow cytometry (n = 3 independent experiments). (Q1: necrotic cells, Q2: late apoptotic cells, Q3: survival cells, Q4: early apoptotic cells). (D) The expression levels of cleaved-caspase 3 in PC9 and H1650 cells (n = 3 independent experiments). Inset: results of Western blot analysis. Untreated cells were used as controls, and β-actin served as the loading control. (E) The migration distance of PC9 and H1650 cells treated with 1 μM Gefitinib, TPG or PPG for 24 h (n = 6); untreated cells were used as controls. The error bars shown in the figures represent the mean ± s.d. Differences were determined with a one-way ANOVA. #P < 0.05, # #P < 0.01 vs. Gefitinib group.

