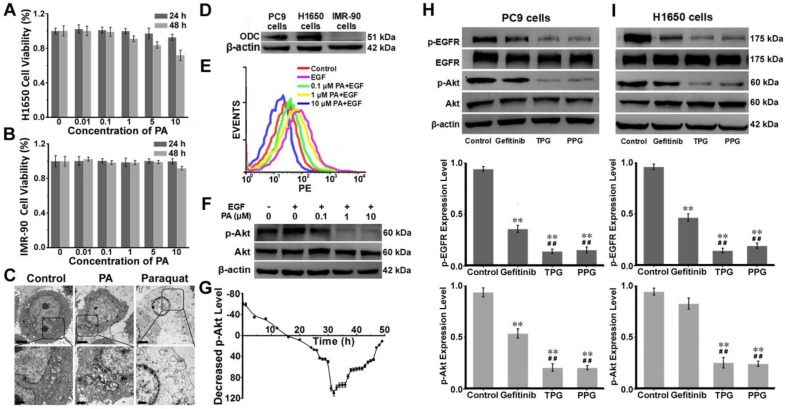
Figure 2.
Mechanism of apoptosis induction by TPG and PPG. Cell viabilities of (A) IMR-90 cells and (B) H1650 cells. Cells were treated with 0, 0.01, 0.1, 1, 5 and 10 μM of PA and measured using the CCK-8 assay. The error bars shown in the figures represent the mean ± s.d. (n = 6 independent experiments). (C) H1650 cells treated with 1 μM PA and 1 μM paraquat for 48 h and observed by transmission electron microscopy (n = 3 independent experiments). Scale bars: 2 μm (upper) and 1 μm (lower). (D) The expression levels of ornithine decarboxylase (ODC) in PC9, H1650, and IMR-90 cells (n = 3 independent experiments). (E) Flow cytometry analysis and (F) Western blot analysis of the levels of p-Akt (Ser 473) and total Akt (n = 3 independent experiments). H1650 cells were treated with PA for 48 h. (G) Decreased levels of p-Akt in H1650 cells treated with 1 μM PA from 0 to 48 h (n = 3 independent experiments). Samples were subjected to stimulation with 10 ng/mL EGF for 5 min. (H) The expression levels of p-EGFR and p-Akt in PC9 cells and (I) H1650 cells (n = 3 independent experiments). Total EGFR and Akt were also tested. The cells were treated with 1 μM Gefitinib, TPG, and PPG for 72 h. The error bars shown in the figures represent the mean ± s.d. Differences were determined with a one-way ANOVA. *P < 0.05, **P < 0.01 vs. control group.# P < 0.05, # # P < 0.01 vs. Gefitinib group.

