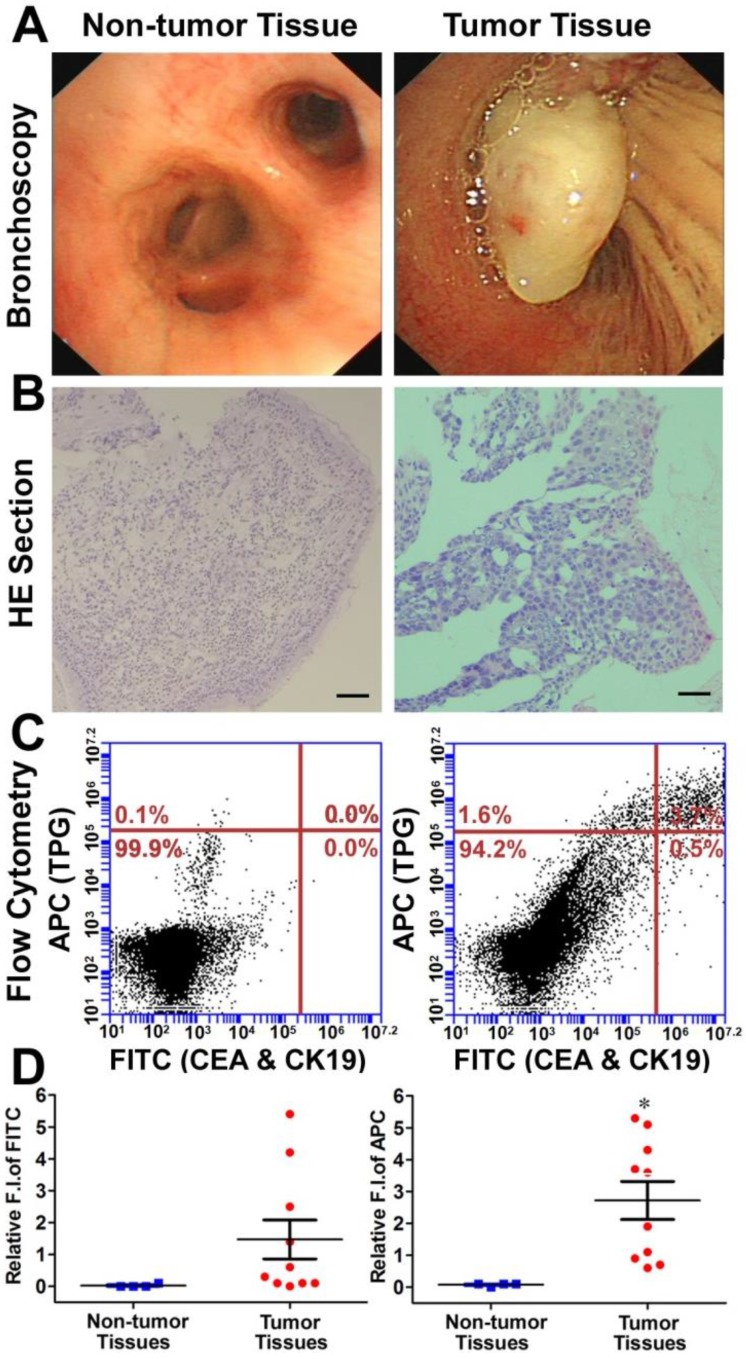
Figure 4.
Diagnosis of TBLB specimens by TPG. (A) Representative non-tumor tissue and tumor tissue specimens were acquired by TBLB. (B) H&E staining of (A). Scale bar: 50 μm. (C) Flow cytometry analysis of TPG and immunofluorescence using anti-CEA and anti-CK19. The cells in the suspension were treated with 1 μM TPG and fixed to process immunofluorescence of CEA and CK19. The results are shown as density plots with CEA and CK19 in the FITC channel and TPG in the APC channel. (D) Statistical data of the FITC and APC channels of the non-tumor tissues (n = 4) and tumor tissues (n = 10). All tissues were confirmed by pathological examination. The data are presented as plot diagrams and the comparisons between two groups were determined using Student's t-test. *P < 0.05 was statistically significant.

