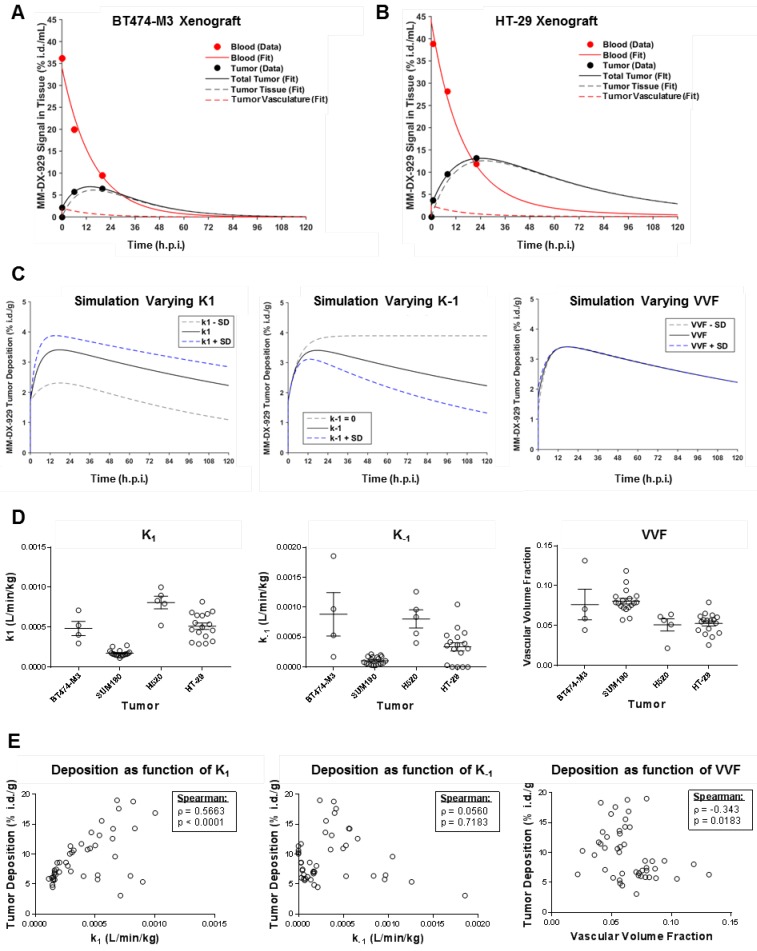
Figure 4.
Modeling of MM-DX-929 transport kinetics and correlation with tumor deposition. (A) and (B) are representative examples of kinetics of MM-DX-929 in blood (solid red line) and tumor (solid black line) in BT474-M3 and HT-29 xenografts, respectively based on tracer kinetic modeling. Longitudinal experimental data for MM-DX-929 in the blood and tumor based on PET images are shown as red and black points, respectively. Simulated kinetics of contributions of tumor vasculature (dashed red line) and tumor interstitium (dashed black line) are also shown. (C) Simulated effect of k1, k-1, and VVF on MM-DX-929 tumor deposition kinetics (mean value (solid black line) ± one standard deviation (dashed lines)). (D) Transport kinetics parameters of MM-DX-929 (k1, k-1, VVF) for individual tumors obtained from PET/CT images of xenograft models injected with MM-DX-929. (E) Correlation of MM-DX-929 tumor deposition at approximately 24 h.p.i. with k1, k-1, and VVF. Data for tracer kinetic modeling are decay-corrected.

