Figure 1.
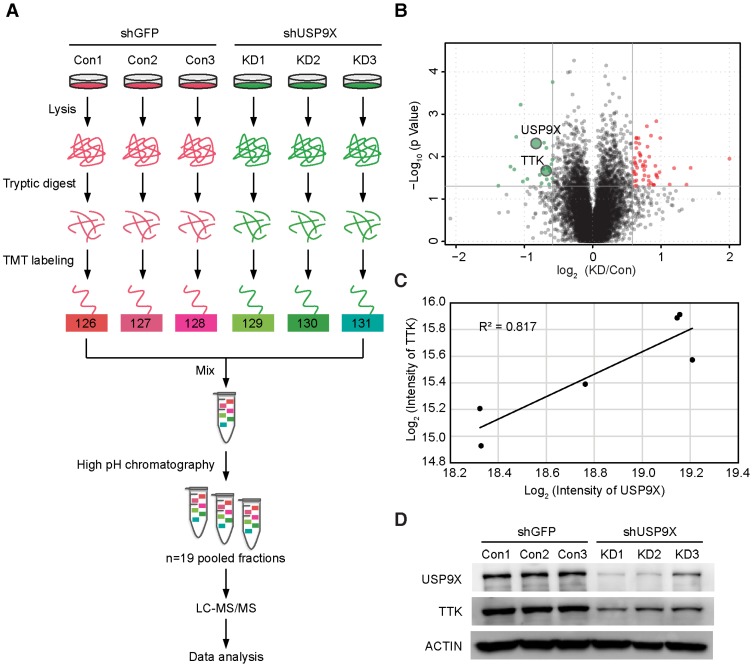
TMT-based quantitative proteomics identifies TTK as a candidate substrate of USP9X. (A) Flow diagram of the TMT-based quantitative proteomics platform applied to identify the substrates of USP9X. A549 cells were stably transfected with 3 different shRNAs targeting USP9X (KD1, KD2, KD3) or control shRNA (Con1, Con2, Con3) and the whole cellular proteins were extracted and quantified. Following trypsin digestion of equal amount of proteins, the resolved peptides were labeled with 6-plex TMT reagents, fractionated by HPLC and analyzed by mass spectrometry. (B) Summary of the TMT labeling assay results. 7471 proteins identified by TMT assay are plotted in the volcano plot, in which the logarithmic ratio of protein intensities in the shUSP9X/control shRNA samples are plotted against negative logarithmic P values of the t-test performed from three replicates. 22 proteins were significantly down-regulated (green), 53 proteins were up-regulated (red) (fold change > 1.5, students' t test P value < 0.05). (C) Decreased USP9X expression correlates with decreased TTK protein level. (D)Validation of protein expression of USP9X and TTK in stably expressing A549 cells by immunoblotting.

