Figure 3.
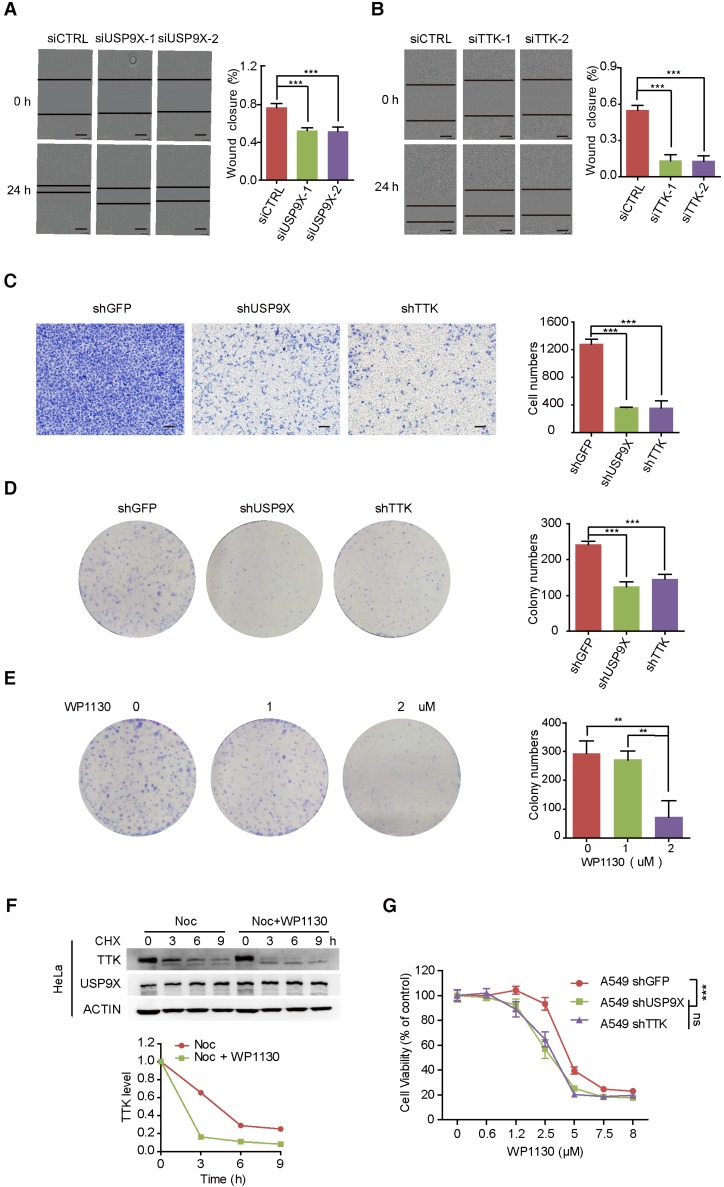
Knock down of USP9X or TTK inhibits cell migration and invasion. (A) A549 cells were transfected with either two different siRNAs targeting USP9X or a control siRNA. After 48 h, cell migration was measured by a wound-healing assay. The wound edges are indicated by black lines. Representative images are shown. The quantitative results are shown on the right. The y-axis represents the percentage of wound closure. Data are represented as mean ± s.d. (n = 3, *** P < 0.001, t-test). Scale bars, 300 µM. (B) The migration ability of A549 cells with depletion of TTK examined via the wound-healing assay as in (A). Data are represented as mean ± s.d. (n = 3, *** P < 0.001, t-test). Scale bars, 300 µM. (C) Stable knockdown of either USP9X or TTK decreased A549 cells' invasion ability, which was measured by a transwell assay. The blue dye indicates the transwell cells. The quantitative results by counting cell numbers are shown on the right. Data are represented as mean ± s.d. (n = 3, *** P < 0.001, t-test). Scale bars, 100 µM. (D) Stable knockdown of either USP9X or TTK decreased A549 cells' colony forming ability, which was measured by a colony formation assay. The quantitative results by counting cell numbers are shown on the right. Data are represented as mean ± s.d. (n = 3, *** P < 0.001, t-test). (E) WP1130, an inhibitor of DUBs, could decrease A549 cells' colony forming ability. A549 cells were treated with the indicated drug concentration for the colony formation assay. After two weeks, cells were subjected to crystal violet staining. Data are represented as mean ± s.d. (n = 3, ** P < 0.01, t-test). (F) HeLa cells were induced into mitosis by treating with nocdazole, then the cells were treated with or without WP1130 as the indicated times and the cells were harvested for immunoblotting. Quantification of TTK levels relative to β-actin are shown. (G) Depletion of USP9X or TTK increased A549 cells' sensitivity to WP1130. A549 cells stably expressing shGFP, shUSP9X or shTTK were seeded into 96-well plates and then treated with different concentrations of WP1130 as indicated. The optical density (OD) at 490 nm for each well was detected. Data are represented as mean ± s.d. (n = 5, *** P < 0.001, t-test).

