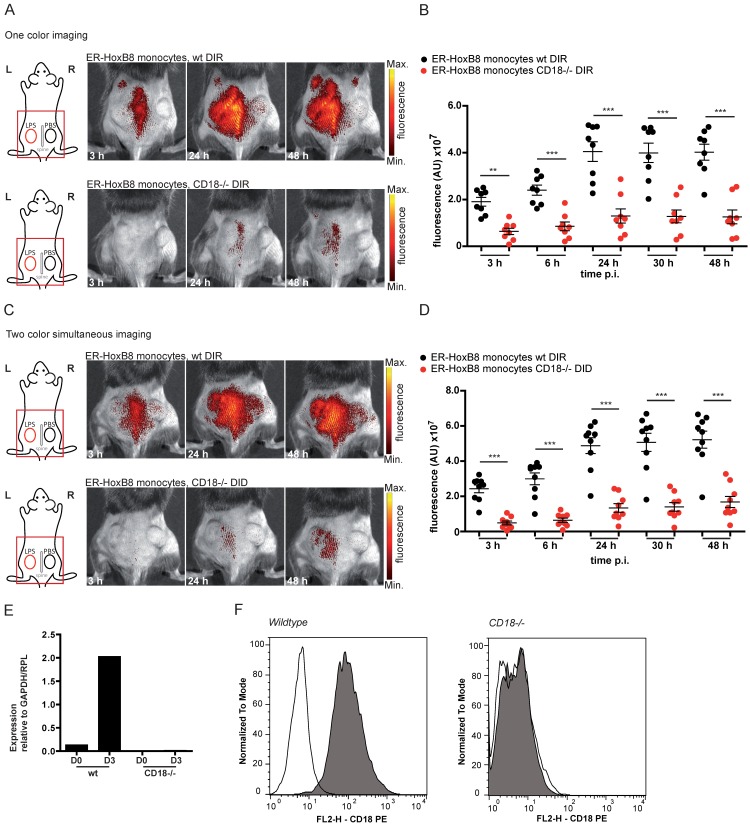
Figure 4.
In vivo optical imaging of wt and CD18-/- monocyte migration in a CG model. ER-HoxB8 wildtype and CD18-/- monocytes were labeled with DIR and each cell population was injected in an individual animal (A-B). Alternatively, ER-HoxB8 wildtype and CD18-/- monocytes were differentially labeled with DIR and DID and injected in the same mouse (C-D). FRI images were taken 0 h, 3 h, 6 h, 24 h, 30 h and 48 h p.i. (A) Representative imaging series of the one color imaging approach in two individual mice 3-48 h p.i. Upper panel shows LPS plug infiltration of wt monocytes (DIR). Lower panel shows LPS plug infiltration of CD18-/- monocytes (DIR). (B) Statistical analysis of imaging of wt and CD18-/- cell migration to LPS plug corresponding to (A) (n=8 mice, 3 independent experiments). (C) Representative imaging series of the two color simultaneous imaging approach in a single mouse 3-48 h p.i. Upper panel shows LPS plug infiltration of wt monocytes (DIR). Lower panel shows LPS plug infiltration of CD18-/- monocytes (DID). (D) Statistical analysis of simultaneous imaging of wt and CD18-/- cell migration to LPS plug corresponding to (C) (n=9 mice, 3 independent experiments). (E-F) Verification of CD18 knockout in ER-HoxB8 CD18-/- monocytes. Representative results are shown. (E) Result of qRT-PCR of wt (day 0 and day 3) compared to CD18-/- monocytes for CD18 mRNA. (F) Flow cytometry analysis of α-CD18 staining of wt and CD18-/- monocytes (day 3). Expression of CD18 was detected as FL2-H+. Open graphs show isotype control; grey graphs show α-CD18 staining. Images orientation: L = left, R = right, fluorescence = fluorescence intensity (AU). Data are shown as dotplots with mean ± SEM, corrected to baseline and labeling efficiency. Statistical significance was calculated using 2-way ANOVA and Bonferroni post-tests comparing ER-HoxB8 wildtype and CD18-/- cells: *p < 0.05, **p < 0.01, ***p < 0.001.

