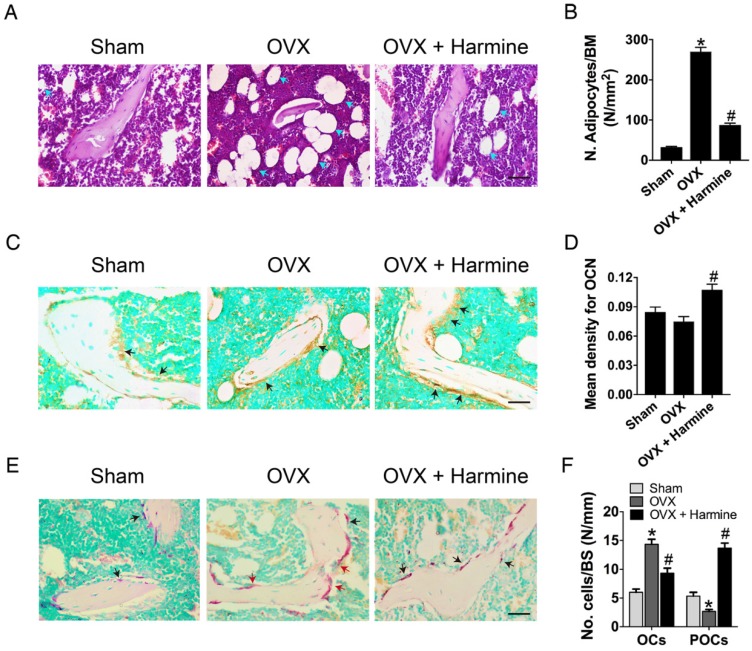
Figure 5.
Harmine emulsion stimulates osteogenesis and represses osteoclast formation in OVX mice. (A-B) Representative H&E stained images (A) and quantification of adipocytes (B) in distal femoral metaphysis regions from sham, OVX and OVX + harmine mice. Blue arrows indicate adipocytes. Scale bar: 50 μm. n = 4 per group. BM: bone marrow. (C) Representative images of OCN immunostaining in femora from sham, OVX and OVX + harmine mice. Black arrows indicate OCN-positive areas. Scale bar: 50 μm. (D) Quantification of the mean intensity for the OCN immunostaining in different treatment groups. n = 4 per group. (E) TRAP staining of femora from sham, OVX and OVX + harmine mice. Red arrows indicate OCs and black arrows indicate POCs. Scale bar: 50 μm. (F) Quantification of TRAP+ OCs and POCs per bone surface (BS) in different treatment groups. n = 3 per group. *P < 0.05 vs. sham group, #P < 0.05 vs. OVX group.

