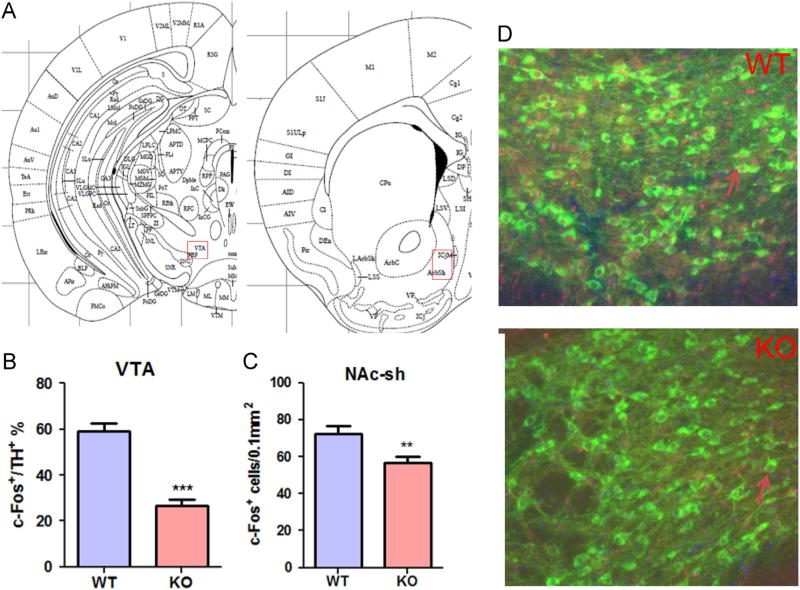
Figure 5.
Fos-ir- neurons following pups retrieval test on PPD2. (A) Histological locations of the mice brain analyzed for Fos-like immunoreactivity. VTA: Ventral Tegmental Area, NAc-sh: Nucleus accumbens shell. (B) The ratio of the Fos positive cell numbers to the TH-positive cell numbers in the VTA in PPD2 WT and MCHR1 KO mice (n = 3). Unpaired t-test (t = 5.1): WT vs. KO, ***P < 0.001. (C) Numbers of Fos positive cells in the NAc-sh (C) following pups’ retrieval test on PPD2 in WT and MCHR1 KO mice (n = 3). Unpaired t-test (NAc-sh: t = 2.8): WT vs. KO, **P < 0.01. (D) Representative micrograph of the immunoreactivity for both Fos (red) and TH (green) in the VTA in PPD2 WT and MCHR1 KO mice. Arrows indicate representative cells immunoreactive for both Fos and TH. (For interpretation of the references to color in this figure legend, the reader is referred to the web version of this article.)

